
Top navigation skipped

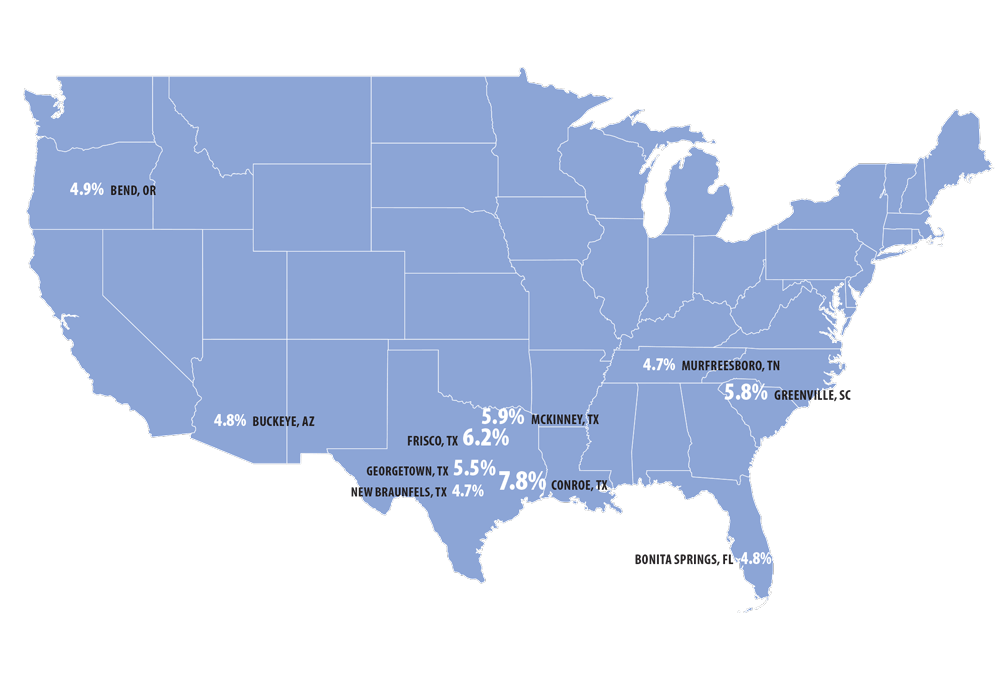
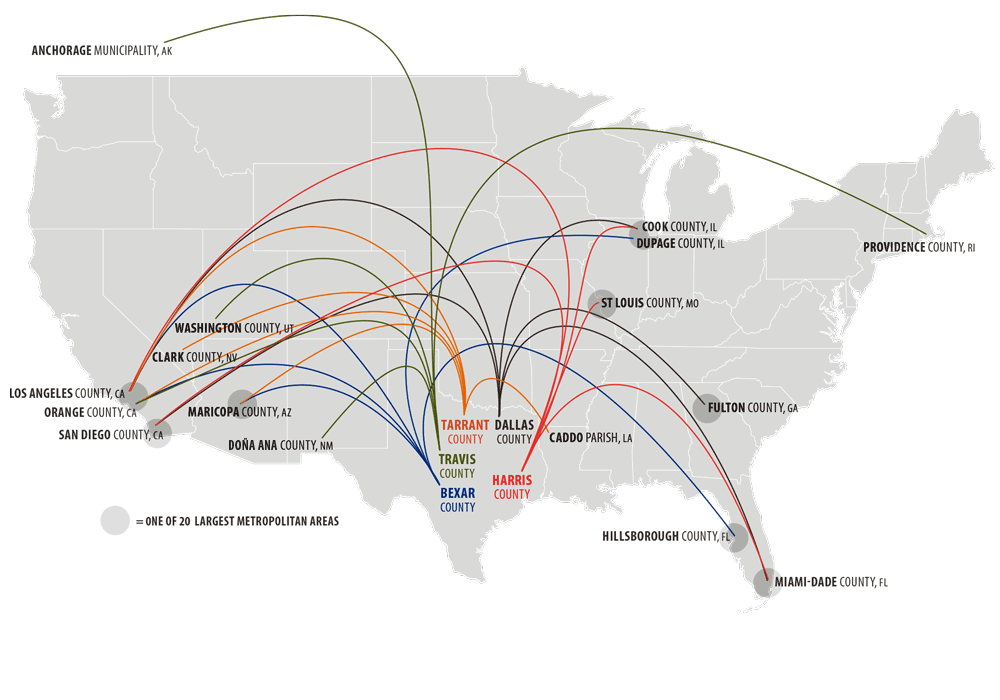
Exhibit 9: NET DOMESTIC MIGRATION TO TRAVIS COUNTY,
Gone To Texas: Migration Who’s Coming and Where They’re Going
If you live in a Texas city, you’ve probably seen endless highway projects and a skyline dotted with cranes. People are drawn to Texas for jobs, a low cost of living and a high quality of life. Our natural resources and central location in the country, adjacent to the sea and on a national border, have helped create and sustain competitive advantages in transportation, energy, wholesale and retail trade and more.
Of course, there’s nothing new about this. People have been flocking to the Lone Star State since its inception.
But who’s coming, and where do they end up?
A deeper understanding of Texas migration patterns can help us understand current trends — and plan accordingly.
A heritage of fast growth
Texas has been a fast-growing state for more than a century, growing more than twice as fast as the U.S. as a whole (Exhibit 1).
Exhibit 1: POPULATION INCREASE FROM 1900 TO 2010
Note: 1900-2010 figures represent decennial Census counts; others are Census estimates as of July 1 of each year. Sources: Texas State Library and Archives Commission and U.S. Census Bureau
The elements of migration
The population of any region is determined by its births, deaths and migration to and from the area.
Of Texas’ total population growth between 2010 and 2016, migration accounted for almost exactly half (Exhibit 2). Net domestic migration — arrivals to and from other U.S. states — represented about 32 percent of the total increase, with net international immigration accounting for 19 percent. “Natural increase,” the population change due to in-state births less in-state deaths, represented 49 percent of the state’s net growth.
This pattern isn’t universal, however. In the same period, for instance, net migration accounted for just 22 percent of California’s population increase, and all those gains represented international immigration; the state’s domestic migration turned negative, with a net loss of more than 383,000 residents to other states.
Exhibit 2: Components of Population change in Texas, April 1, 2010 to July 1, 2016
| Births | Deaths | Natural Increase | Net Migration: Domestic | Net Migration: International | Net Migration: Total | Total Population Change |
|---|---|---|---|---|---|---|
| 2,437,794 | 1,117,880 | 1,319,914 | 866,933 | 508,843 | 1,375,776 | 2,716,496 |
Notes: The total population change estimate in this exhibit reflects the Census Bureau’s use of its “estimates base” for 2010 rather than the actual, slightly different, decennial count. It also includes a “residual” amount that cannot be attributed to any specific demographic component.
Source: U.S. Census Bureau, “Cumulative Estimates of the Components of Resident Population Change for the United States, Regions, States, and Puerto Rico: April 1, 2010 to July 1, 2016”
A 2016 report by the Texas Demographic Center analyzed the state’s migration patterns for the 2009-2013 period in detail. On average, only about 16 percent of moves in this period represented net migration to the state (Exhibit 3). The remainder moved within Texas, with nearly 61 percent staying within the same county. While such moves don’t change the state’s total population, they can have significant demographic and economic effects on the areas involved.
Exhibit 3: SHARE OF MOVES BY MIGRATION TYPE IN TEXAS, 2009 - 2013
Source: Texas Demographic Center
But the pattern varies with location. According to the Texas Demographic Center, smaller counties (those with populations of 65,000 or less) received the majority of their new residents from other parts of Texas. Larger counties received most new residents from other states, while border counties, unsurprisingly, received a majority of new residents from international immigration.
Where from? Where to?
Americans traditionally are a mobile breed, constantly on the move for new opportunities. In 2015, California and Florida ranked first and second, respectively, both as the most common last residence of new Texans and the most common destination for those leaving Texas (Exhibit 4). In both cases, the balance of inflow and outflow favored Texas.
Exhibit 4: TOP STATES FOR TEXAS IN-MIGRATION AND OUT-MIGRATION, 2015 ESTIMATES
Source: U.S. Census Bureau, 2015 American Community Survey One-Year Estimates
In the 2010-2016 period, Texas led all states in net domestic migration, with nearly 867,000 new residents (Exhibit 5).
Exhibit 5: Net Domestic Migration, 2010-2016
| State | Net Domestic Migration Gain |
|---|---|
| Texas | 866,933 |
| Florida | 866,484 |
| Colorado | 243,671 |
| North Carolina | 242,283 |
| Arizona | 223,380 |
| State | Net Domestic Migration Loss |
|---|---|
| Michigan | -215,872 |
| New Jersey | -336,359 |
| California | -383,344 |
| Illinois | -540,166 |
| New York | -846,669 |
Source: U.S. Census Bureau, “Cumulative Estimates of the Components of Resident Population Change for the United States, Regions, States, and Puerto Rico: April 1, 2010 to July 1, 2016”
Patterns within Texas
The vast majority of Texas’ population growth occurs in its metropolitan areas, due to the jobs and economic opportunities they offer. Texas has three of the nation’s 10 most populous cities (Houston at fourth, San Antonio, seventh and Dallas, ninth) and two of its 10 largest metropolitan areas (Dallas-Fort Worth-Arlington, fourth, and Houston-The Woodlands-Sugar Land, fifth).
In 2016, Texas was home to five of the nation’s 10 fastest-growing cities of 50,000 or more, including the top three (Exhibit 6).
Exhibit 6: The 10 Fastest-Growing Large cities, July 2015 to July 2016 (Populations of 50,000 or more)
- Bend, OR: 4.9%
- Buckeye, AZ: 4.8%
- Frisco, TX 6.2%
- Georgetown, TX 5.5%
- New Braunfels, TX 4.7%
- McKinney, TX 5.9%
- Conroe, TX 7.8%
- Murfreesboro, TN 4.7%
- Greenville, SC 5.8%
Source: U.S. Census Bureau
The Census Bureau’s county-level statistics indicate that migration among states is largely a metropolitan affair. Exhibit 7 shows the five U.S. counties contributing the most net domestic migration to each of Texas’ five most populous counties from 2011 through 2015. Of the 25 possible positions, 19 are counties within the nation’s 20 largest metropolitan statistical areas.
The data offer some support for the popular notion that Texas is providing a haven for Californians escaping the state’s cost of living and sky-high real estate prices; nine of the 25 slots are occupied by California counties. Ironically, though, while Austin is often considered the epicenter of this phenomenon, the exhibit also indicates that Travis County draws new residents from a remarkably diverse set of locations.
Exhibit 7: Net domestic Migration to Texas’ Most Populous counties, 2011-2015, Top Five Origin Counties for each
Source: U.S. Census Bureau, 2011-2015 American Community Survey
Exhibit 8 examines more recent Census immigration data for the five most populous Texas counties. Note that, despite in-migration from dozens of other states, both Dallas and Harris counties experienced negative domestic migration between July 1, 2015, and July 1, 2016. In both cases, however, net international immigration more than made up the difference.
Exhibit 8: NET DOMESTIC AND INTERNATIONAL MIGRATION FOR TEXAS’ FIVE MOST POPULOUS COUNTIES, JULY 1, 2015 TO JULY 1, 2016
Source: U.S. Census Bureau, "Estimates of the Components of Resident Population Change: April 1, 2010 to July 1, 2016 — 2016 Population Estimates"
Austin: This Place is Turning Into … Florida?
Austin’s a booming high-tech hub, and to many locals, growth spells one thing: Californians. Yet according to the Census Bureau, those crowded roads may be carrying more ex-Floridians than former residents of the Golden State.
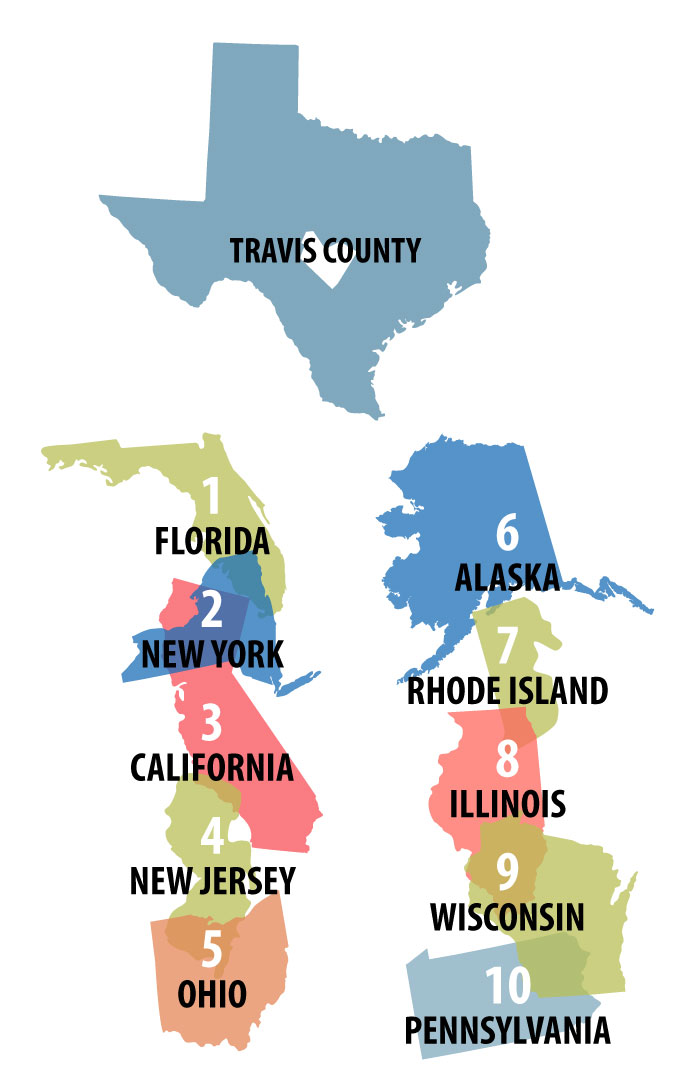
Of the top 10 states accounting for Travis County’s net domestic migration, California placed only third between 2011 and 2015 (Exhibit 9).
Exhibit 9: NET DOMESTIC MIGRATION TO TRAVIS COUNTY,
2011-2015: TOP 10 STATES BY SHARE OF TOTAL
- #1 Florida
- #2 New York
- #3 California
- #4 New Jersey
- #5 Ohio
- #6 Alaska
- #7 Rhode Island
- #8 Illinois
- #9 Wisconsin
- #10 Pennsylvania
Source: U.S. Census Bureau, 2011-2015 American Community Survey
And still they come
Despite the fluctuations of the state and national economies, businesses and their employees continue coming to the Lone Star State, attracted by its high quality of life and business-friendly tax and regulatory structure.
According to the Tax Foundation, Texas has the nation’s fifth-lowest state and local tax burden, and recently Chief Executive Magazine named Texas the “Best State for Business” for the 13th year in a row. In the year ending in August 2017, Texas added more jobs (nearly 299,000) than any other state. Recent arrivals include the North American headquarters of Toyota and Kubota Tractor, both formerly based in California. In 2017, Site Selection magazine awarded Texas its Governor’s Cup, citing 642 projects expanding or creating new corporate facilities in the state.
Texans know what keeps us here, and the rest of the country is catching on.
But growth brings its own challenges. Texas’ population is expected to reach nearly 60 million by 2050, bringing with it skyrocketing demand for water, housing, transportation, schools and jobs.
Housing in Texas’ urban areas is increasingly expensive, due in part to high demand from new residents. According to the Texas Association of Realtors, home sales and home prices hit record highs in both 2015 and 2016. Inevitably, some are being priced out of the hottest markets. Texas’ homeownership rate was 61.5 percent in 2016, eighth-lowest among the 50 states, and it’s been falling since 2008, due at least in part to rising housing costs.
Transportation needs will change dramatically. In some areas, highways such as I-35 and I-10 can’t keep up with current traffic. Of course, teleworking, ridesharing and mass transit may change the picture in the future, but in the near term Texas cities can expect worsening traffic and deteriorating road conditions.
And of course, not all areas of Texas are growing. Rural counties losing residents to metropolitan areas face their own challenges, such as access to health care, teacher shortages and inadequate local government revenues.
No matter what the future holds, though, some people will always be drawn to Texas. Texans have faced many challenges over the years, and they’re up for this one as well. FN
Related:
- Texas Housing Prices on the Rise (March 2018)
- North Texas Eases Silicon Valley's Housing Squeeze (January 2018)
- Texas Toasts: A Roundup of Bright Economic News in Texas (April 2018)
- Transportation Infrastructure (May 2018)
- Millennials – The New Normal (October 2016)