Skip navigation

Top navigation skipped
Kelly Hancock
Acting Texas Comptroller of Public Accounts
Kelly Hancock
Acting Texas Comptroller of Public Accounts
Kelly Hancock
Acting Texas Comptroller of Public Accounts
Main Search
Why it Counts: A Closer Look at the Biennial Revenue Estimate
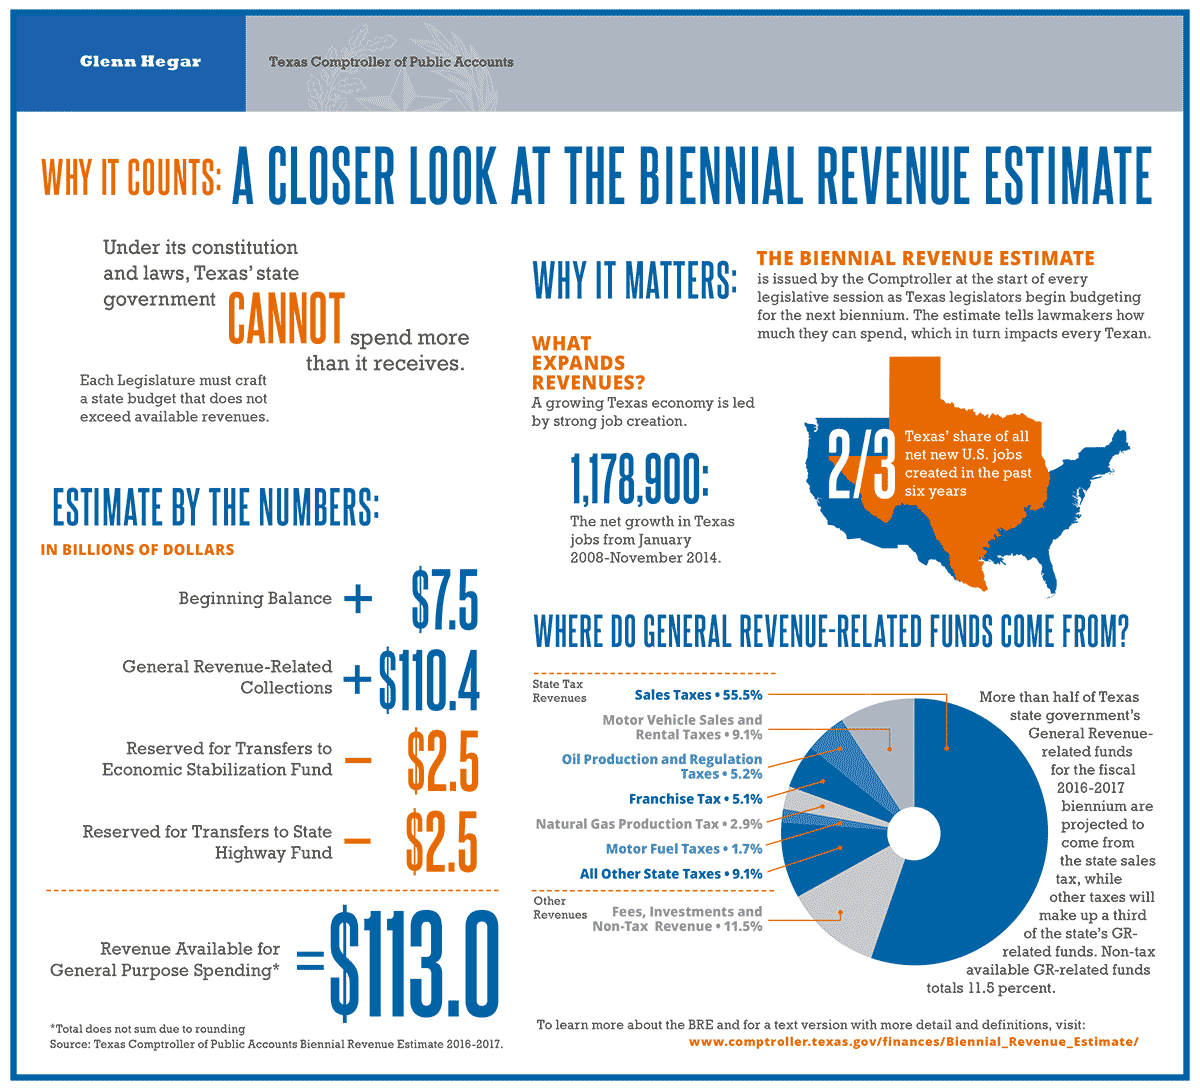
Under its constitution and laws, Texas state government cannot spend more than it receives. Each Legislature, then, must craft a state budget that does not exceed available revenues. The Comptroller produces an estimate of these revenues called the Biennial Revenue Estimate, or BRE.
Our Estimate by the Numbers.
Beginning Balance for 2016-2017: $7.5 billion.
(This represents the surplus remaining from 2014-2015 spending.)
Added to this are:
General Revenue Collections: $110.4 billion.
(Generally, these are revenues not dedicated by state law to a specific purpose, such as highway construction or education.)
These total to $117.9 billion.
From this amount, we subtract two sums.
Transfers to Economic Stabilization Fund: $2.5 billion.
(Each year, the state puts away some funding for future purposes; this is often called the “Rainy Day Fund.”)
And also,
Transfers to State Highway Fund: $2.5 billion.
(This amount represents additional transportation funding Texas voters approved in fall 2014.)
This leaves revenue available for general-purpose spending of $113 billion.
(Again, these are generally revenues not dedicated by law to specific purposes.)
Why it Matters.
The Comptroller’s office issues the BRE at the beginning of every legislative session. The estimate tells lawmakers how much they can spend in the next state budget, which in turn affects every Texan.
What Expands State Revenues?
State revenues are lifted by a growing economy featuring strong job creation.
Texas added 1,178,900 net new jobs between January 2008 and November 2014. In the past six years, Texas created two-thirds of all net new jobs in the U.S.
Where Do General Revenue-Related Funds Come from?
More than half of Texas state government’s general-revenue-related funds for the 2016-2017 biennium will come from the state’s sales tax. Other taxes will make up a third of these funds, while revenue from other sources, such as fees and investments, will account for 11.5 percent of the total.
| Source | Percent of Total |
|---|---|
| Sales Taxes | 55.5% |
| Motor Vehicle Sales and Rental Taxes | 9.1% |
| Oil Production and Regulation Taxes | 5.2% |
| Franchise Taxes | 5.1% |
| Natural Gas Production Tax | 2.9% |
| Motor Fuels Taxes | 1.7% |
| All Other State Taxes | 9.1% |
| Fees, Investments and Other Nontax Revenue | 11.5% |
* Totals do not sum due to rounding,
Source: Texas Comptroller of Public Accounts Biennial Revenue Estimate 2016-2017.
A Closer Look at the Biennial Revenue Estimate 2016-2017 (PDF)