Skip navigation

Top navigation skipped

Advanced Industries Drive Job Growth Higher Wages Lift Other Employment Sectors
There are jobs, and then there are good jobs. While any new job signals positive economic activity, the best jobs offer long-term opportunities and the disposable income that generates demand for goods and services, benefiting the broader economy. And these jobs, then, are the real goal of economic development officials and government leaders.
The Brookings Institution’s 2015 report America’s Advanced Industries attempts to quantify the job sectors that are boosting U.S. employment or wages, and points to the prominent successes featured in a group of 50 industries, the so-called advanced industries (AI), which invest heavily in technological innovation and employ skilled technical workers.
Advanced industries represent innovative sectors that have driven productivity gains in our economy. These are the industries behind innovations such as 3-D printing, advanced materials and robotics, and breakthroughs in business processes and service delivery that employ sophisticated analytics, “big data” and cloud computing.
While advanced industries offer a relatively small share of jobs (9.5 percent of Texas employment in 2014), small businesses in the communities where advanced industries operate — from dry cleaners and restaurants to doctors and lawyers — benefit greatly from their presence. Brookings estimates that one advanced industry job stimulates 2.2 indirect jobs. If so, about 25 percent of all American jobs are related either directly or indirectly to advanced industries.
Advanced industries employ 80 percent of the nation’s engineers, and account for 90 percent of private-sector research and development (R&D) spending and 85 percent of U.S. patents issued. They’re also highly interconnected with other industries — U.S. employers in advanced industries spend an average of $236,000 per worker on related goods and services, compared to just $67,000 per worker in other industries.
Brookings reports that California, Texas, New York, Illinois and Michigan together provide 35 percent of the nation’s AI jobs. Typically, advanced industries cluster in metropolitan areas; Houston and Austin ranked among the top metro areas for AI employment in 2014. Austin’s tech jobs paid an average of more than $100,000 annually in 2014. Houston’s diverse AI community provides more than 363,000 jobs in the metro area, or 12.5 percent of total employment.
AI in Texas
In the past decade, Texas’ employment in advanced industries rose substantially faster than in the nation as a whole.
Texas AI employment rose by 24.1 percent or 1.1 million jobs between 2004 and 2014, compared to a 20.7 percent increase in all Texas employment. In the same period, national AI employment rose by just 5.4 percent, barely outpacing the 4.9 percent increase in all U.S. jobs (Exhibit 1).
Exhibit 1: Advanced Industry Share of Total Employment and Percent Changes, 2004-2014
| Metropolitan Area (ranked by most jobs created) | Advanced Industries as Share of All Jobs | Percent Employment Change, 2004-2014 | ||
|---|---|---|---|---|
| 2004 | 2014 | Advanced Industries | Total Employment | |
| Dallas-Fort Worth-Arlington | 11.0% | 10.3% | 10.9% | 17.9% |
| Houston-The Woodlands-Sugar Land | 12.0% | 12.5% | 31.0% | 25.2% |
| San Antonio-New Braunfels | 5.7% | 6.7% | 40.7% | 20.7% |
| Austin-Round Rock | 12.6% | 12.7% | 34.1% | 32.5% |
| El Paso | 5.3% | 4.4% | -3.7% | 18.1% |
| McAllen-Edinburg-Mission | 2.6% | 2.1% | 0.5% | 25.5% |
| TEXAS | 9.2% | 9.5% | 24.1% | 20.7% |
| United States | 8.7% | 8.8% | 5.4% | 4.9% |
Sources: Economic Modeling Specialists Intl., Texas Comptroller of Public Accounts, The Brookings Institution
Distribution of Texas’ Advanced Industries
As Exhibit 1 illustrates, Texas’ AI employment isn’t evenly distributed among metropolitan statistical areas (MSAs) — and that disparity is growing, according to a Comptroller analysis (Exhibit 2). Ten Texas MSAs lost AI jobs in the 2004-2014 decade, and 14 saw their share of jobs in AI industries decline. Particularly apparent was the shortage of advanced-industry jobs outside the major metro areas and the oil patch; communities along the Mexico border and in the Panhandle, far North Texas and Northeast Texas all lost AI jobs.
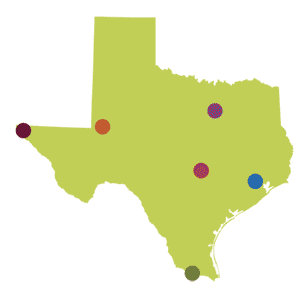
Exhibit 2: Advanced Industries in Texas Metro Areas, 2004 to 2014
AI accounted for 12.7 percent of AUSTIN-ROUND ROCK’S total employment in 2014, followed closely by the HOUSTON-THE WOODLANDS-SUGAR LAND MSA at 12.5 percent. Advanced industries in these areas outpaced total employment growth from 2004 to 2014.
The greater HOUSTON area accounts for more than 32 percent of the state’s AI jobs, while the DALLAS-FORT WORTH metro area has almost 30 percent.
The border MSAs of MCALLEN-EDINBURG-MISSION and EL PASO had the lowest shares of AI employment in 2014, and each area had stagnant or declining AI employment in the 2004-2014 period.
Energy-sector hotspots MIDLAND and ODESSA saw signicant increases in AI and total employment from 2004 to 2014; they also enjoyed the largest wage increase in non-AI jobs, at 88 percent and 79 percent, respectively.
Advanced Industry Trends
Brookings divides its roster of AI industries among manufacturing, energy and services. In the 2004-2014 period, AI service employment rose by 45 percent, and added the most jobs in Texas by far; AI energy employment rose by 39 percent, although the sector is much smaller and added fewer jobs. The global downturn in oil prices can be expected to temper this sector’s growth. The state’s AI manufacturing employment rose at a much slower rate (3 percent), but nationwide, the AI manufacturing sector saw job losses of 12 percent (Exhibit 3).
Among the metro areas, Houston unsurprisingly saw substantial growth in AI energy employment (34 percent), but AI service employment rose even faster (40 percent). The most spectacular growth in AI energy employment occurred in Austin, at 143 percent, but the numerical gain was just 2,600 jobs, a very small part of the state’s energy employment.
Exhibit 3: Change in Advanced Industries Employment in Texas, the U.S. and the Largest Texas Metro Areas, 2004 to 2014
Roll over the chart for specific values.
Source: Economic Modeling Specialists Intl., Texas Comptroller of Public Accounts, The Brookings Institution
A few of Texas’ advanced industries have grown very strongly, shoring up the whole sector, and particularly offsetting job losses in manufacturing (Exhibit 4). In fact, without the 28,000 jobs added from 2004 to 2014 in the Agriculture, Construction and Mining Machinery category, which is strongly related to the energy industry, total Texas AI manufacturing employment would have declined by almost 16,000 jobs. Even so, the category saw declines from 2013 to 2014.
The greatest gains in Texas’ advanced industries occurred in Computer Systems Design and Related Services, which nearly doubled in size during the decade. Notably, the greatest AI losses were in Semiconductor and Other Electronic Component Manufacturing, highlighting the economy’s continuing transition from manufacturing to services, even in high tech. The next two greatest AI gains were in industries providing professional services, Management, Scientific and Technical Consulting and Architectural, Engineering and Related Services.
Interestingly, despite a gain of 218,000 AI jobs in Texas during the decade, 27 of the 50 AI categories actually saw declines in employment.
Exhibit 4: Greatest Job Gains and Losses Among Advanced Industries in Texas
Source: Economic Modeling Specialists Intl., Texas Comptroller of Public Accounts, The Brookings Institution
Better Pay, But Wages Vary By Region
The advanced industries' higher-than-average wages are naturally coveted by states competing for job growth. In 2014, these jobs paid average annual salaries of $99,967 in Texas, 10.4 percent higher than the U.S. average. By contrast, the average wage for all Texas jobs, about $51,000 annually, is just 3.5 percent higher than the U.S. average (Exhibit 5).
For AI workers in most Texas metro areas, the financial rewards are significant, paying on average at least 40 percent more in every MSA except Killeen-Temple, and more than twice the average wage in the Beaumont-Port Arthur and Sherman-Denison areas.
AI jobs in McAllen and Brownsville pay wages 50 percent higher than average for those communities, but less than the overall average statewide wage. In both MSAs, advanced-industry jobs represent less than 3 percent of the workforce; Brownsville lost more than 1,100 AI jobs between 2004 and 2014.
Exhibit 5: Average Texas Wages in 2014
Source: Economic Modeling Specialists Intl., Texas Comptroller of Public Accounts, The Brookings Institution
Exhibit 5 underlines the fact that advanced industries tend to benefit some metro areas more than others. Business location decisions can be complex, but the availability of energy resources, technology and skilled workers clearly prompts AI companies to cluster in some areas rather than others.
Identifying the less-favored metro areas and focusing efforts to recruit AI jobs there would help raise wages and improve both the local and state economies. FN
For more information on advanced industries, see the Brookings Institution’s report.