Texas Road Finance (Part I)Paying for Highways and Byways
Texas’ highway network, the nation’s largest, is the backbone of its economy. Our economic growth depends in large part on the efficiency, reliability and safety of our highways and transportation systems, which support individual mobility needs as well as commerce and industry.

But our roads face challenges from population growth, deteriorating infrastructure and rapidly rising road construction costs.
Texas led the nation in job creation between 2010 and 2015, and projections by the Texas State Data Center indicate the state’s population may increase to more than 45 million by 2040. By then, according to the Texas Department of Transportation (TxDOT), Texas’ annual truck freight tonnage is expected to more than double from its 2014 level.
It’s clear that maintaining the state’s economic momentum will require major improvements in our transportation infrastructure.
TxDOT and Texas Roads
The Federal Aid to Roads Act of 1916, the nation’s first law providing federal funding for road construction, prompted the states to create agencies to administer these funds. Texas established its Highway Department in 1917. By 1925, the agency had been given full control of the design, engineering, construction and maintenance of the state’s highways, including the right to acquire land and rights of way for highway construction through eminent domain.
The agency has undergone various changes to its name and responsibilities over the decades. Its present-day iteration was born in 1991, when the Highway Department became TxDOT, incorporating the previous State Department of Highways and Public Transportation, Department of Aviation and Texas Motor Vehicle Commission.
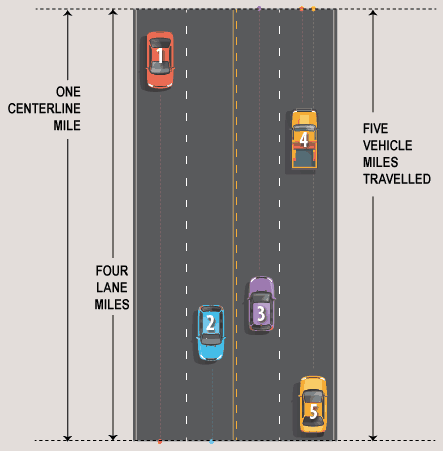
Today’s Texas highway network, maintained by TxDOT, includes nearly 73,000 centerline miles and more than 180,100 lane miles of paved interstate highways, U.S. highways, state highways, loops, business routes, farm- or ranch-to-market roads, spurs and park roads, among others.
By 2040, TxDOT projects that motorists will drive 800 million vehicle miles daily, compared to about 455 million miles a day in 2014 (Exhibit 1).
Exhibit 1: State-Maintained Roads and Highways in Texas, 2014
| Classification | Number of Centerline Miles | Number of Lane Miles | Daily Vehicle Miles Traveled |
|---|---|---|---|
| Interstate Highways | 3,417 | 16,376 | 167,083,705 |
| U.S. Highways | 11,905 | 35,326 | 104,644,771 |
| State Highways, Spurs, Loops, Business Routes | 16,390 | 42,726 | 112,992,589 |
| Farm- or Ranch-to-Market Roads | 40,910 | 84,925 | 69,154,237 |
| Park Roads | 348 | 771 | 706,312 |
| TOTAL | 72,970 | 180,124 | 454,581,615 |
Source: Texas Department of Transportation
Rough Road Ahead?
Despite its vast extent, Texas’ transportation network is struggling to serve the state’s growing population and business community.
According to TxDOT, drivers in Texas’ largest metropolitan areas averaged about 52 hours stuck in traffic in 2015. Such delays are only expected to increase, threatening economic activity as well as air quality. Today’s congestion is likely to become tomorrow’s gridlock.
Meanwhile, many Texas bridges, roads and highways are showing their age. Recent studies show our roads need extensive maintenance and enhanced safety features. The American Society of Civil Engineering considers at least 38 percent of Texas’ major roads to be in poor or fair condition.
Texas has about 53,000 bridges, more than any other state. Of these, the Federal Highway Administration rated nearly 19 percent as either "structurally deficient" or "functionally obsolete" in 2015. A bridge is considered structurally deficient if any of its major components are significantly deteriorated. Functionally obsolete bridges no longer meet current highway design standards, often because of narrow lanes, inadequate clearances or poor alignment.
Between 2009 and 2013, 15,865 people were killed in traffic crashes in Texas, an average of 3,173 per year. Texas’ 2015 traffic fatality rate of 1.39 fatalities per 100 million vehicle miles traveled ranked considerably above the national rate of 1.09. Of course, many of these deaths weren’t related, directly or indirectly, to road conditions — driving while intoxicated remains the biggest cause of fatal car accidents by far — but highway improvements do help reduce the incidence of crashes, while improving traffic flow.
Where the Money Comes From
Most federal and state road funding across the nation comes from taxes on motor fuels as well as general sales taxes and other levies.
Federal taxes go to the federal Highway Trust Fund (HTF), which supports highway and mass transit programs and projects, formula-based state grants and other programs identified by Congress.
Funding for Texas’ State Highway Fund (SHF) — almost $21 billion for the state’s 2016-2017 biennium — comes from several sources, the largest by far being the federal government, which supplies just under half of Texas highway revenue (Exhibit 2). The state’s motor fuels taxes and auto registration fees account for the bulk of state revenue.
Exhibit 2: Sources of State Highway Fund Revenue Estimates for Fiscal 2016 and 2017
| STATE REVENUE | Fiscal 2016 | Fiscal 2017 |
|---|---|---|
| Motor Fuels Taxes Allocations | $2,558,220 | $2,600,847 |
| Motor Vehicle Registration Fees | 1,419,568 | 1,455,057 |
| Severance Taxes Allocations | 1,134,668 | 594,182 |
| Other Revenue* | 202,021 | 193,924 |
| Supplies, Equipment, Services — Federal/Other | 184,434 | 160,000 |
| Special Vehicle Permit Fees | 101,232 | 101,232 |
| Motor Fuel Lubricants Sales Tax | 44,500 | 44,900 |
| Interest on State Deposits and Investments, General Non-Program | 21,946 | 16,048 |
| Sales of Publications and Advertising | 6,600 | 6,600 |
| Total State Revenue | $5,673,189 | $5,172,790 |
| FEDERAL INCOME | Fiscal 2016 | Fiscal 2017 |
| Federal Receipts Matched — Transportation Programs | $5,206,283 | $4,770,002 |
| Federal Receipts Not Matched — Other Programs | 21,705 | 21,705 |
| Total Federal Income | $5,227,988 | $4,791,707 |
| Total State Highway Fund Revenue | $10,901,177 | $9,964,497 |
*Other revenue includes reimbursements and other miscellaneous fees, charges and revenue.
Source: Texas Comptroller of Public Accounts
Prior to recent actions by the Texas Legislature, however, these traditional funding sources for transportation projects were being strained to the limit, and not only because of population and general economic growth.
The recent oil and gas boom in shale formations, for instance, pushed thousands of heavy trucks on rural Texas roads not designed for such traffic. While the boom has subsided, the damage to overstressed roads remains.
Furthermore, the cost of road construction has risen much faster than the general inflation rate, meaning our transportation dollars simply don’t go as far. In 2014, TxDOT reported that construction costs had risen by 80 percent since 2002, compared to a cumulative general inflation rate of about 32 percent.
Finally, the significant increase in automotive fuel efficiency in recent years, prompted by new technologies and stiffer federal standards, has had positive effects on individual wallets but negative ones on motor fuels taxes. Texas and U.S. motor fuels taxes are based on volume — so many cents per gallon. When fuel efficiency increases, the associated tax revenues decline.
New Revenue for Roads
Recognizing Texas’ chronic need for additional highway funding, recent legislative sessions have added major new funding for transportation projects.
In 2013, for instance, the Legislature appropriated $225 million in extra funding for the repair and maintenance of county roads and bridges affected by the shale energy boom, and another $225 million for other county transportation projects.
In November 2014, 80 percent of Texas voters approved Proposition 1, an amendment to the Texas Constitution directing more funds to transportation. The state’s Economic Stabilization Fund (its "Rainy Day Fund") receives 75 percent of the state’s oil and gas production tax revenue in excess of fiscal 1987 revenues. Proposition 1 now redirects up to half of this amount for highways, based on the decisions of the committee of legislators that guide the ESF.
Under Proposition 1, $1.7 billion was deposited into the SHF in fiscal 2015 for transportation projects. In fiscal 2016, Prop 1 added an additional $1.1 billion.
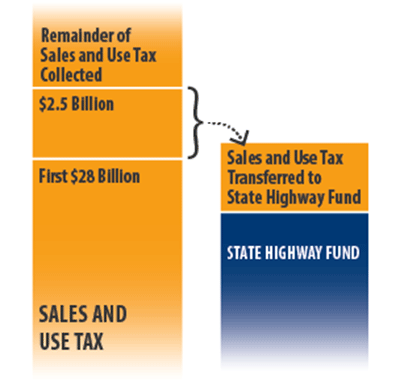
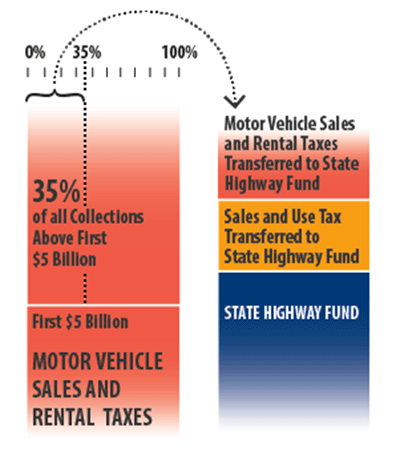
Another boost for state transportation projects came in November 2015, when voters approved another constitutional amendment, Proposition 7, which could constitute the largest increase in transportation funding in Texas history (Exhibit 3).
Exhibit 3: Proposition 7, Transfers To the State Highway Fund (SHF)


Source: Texas Department of Transportation
Starting in fiscal 2018, Prop 7 directs the Comptroller’s office to annually deposit to the SHF $2.5 billion of net revenue from the state sales tax, after total sales tax receipts exceed $28 billion.
This annual transfer will expire at the end of fiscal 2032 unless a future Legislature extends it.
In fiscal 2020, Prop 7 further directs the Comptroller to annually transfer to the SHF 35 percent of state motor vehicle sales tax revenue above the first $5 billion of such revenue collected.
In recent testimony before the Senate Finance Committee, Comptroller Glenn Hegar indicated that this provision would generate $375 million in highway revenue in its first year. The motor vehicle sales and rental tax transfer will expire at the end of fiscal 2029, again unless lawmakers choose to extend it.
Recently, the federal government also took steps to increase funding for mobility needs. The Fixing America’s Surface Transportation Act (FAST), signed into law in December 2015, will provide state and local governments with about $305 billion in additional funding for highway and transit projects. According to the Federal Highway Administration, FAST could direct up to $18.3 billion to Texas between 2016 and 2020.
Unmet Needs
In September 2015, TxDOT estimated that about $60 billion is needed in the next five to 10 years for projects to improve connectivity and traffic flow in our urban areas, as well as $20 billion for statewide connections and border-trade projects.
Texas’ transportation needs are still mounting. As our roads and highways continue to age, they’ll reach a point at which routine paving and maintenance are not enough to keep pavement surfaces in good condition.
In the past, various ideas proposed to increase road funding have included raising the gasoline tax or indexing it for inflation; increasing vehicle registration fees; building more toll roads; seeking local funding through transportation reinvestment zones; and creating public-private sector partnerships for road construction and improvements.
Whatever the method, Texas policymakers will have much to consider as they work to keep our surface transportation network supporting healthy economic growth.
Next month, in Part 2 of this article, we’ll examine the economic impact of road construction on the state and local economies. FN
For more information on Texas roads and transportation projects, visit the Texas Department of Transportation at http://txdot.gov.

