Texas is experiencing a population boom, adding nearly 4 million residents over the past decade. In 2021, the state had an estimated population of more than 29.5 million people, with about 88 percent of the growth concentrated in the state’s largest metro areas. In addition to new residents, businesses are flocking to Texas. Last year alone, 63 companies announced plans to move their headquarters here, with more companies planning to do the same this year.
Continued growth in population and industry means increased demand for energy to power appliances, machinery and other equipment necessary for daily life, as well as for the manufacturing of products that require fossil fuels to produce. Rising demand raises a myriad of questions: How do we generate enough energy to meet our needs? How do we get that energy where it needs to go? Are the sources of energy generating electricity when the demand peaks? What is the mix of generation needed today and in the decades ahead?
Evolving Role of Renewable Resources
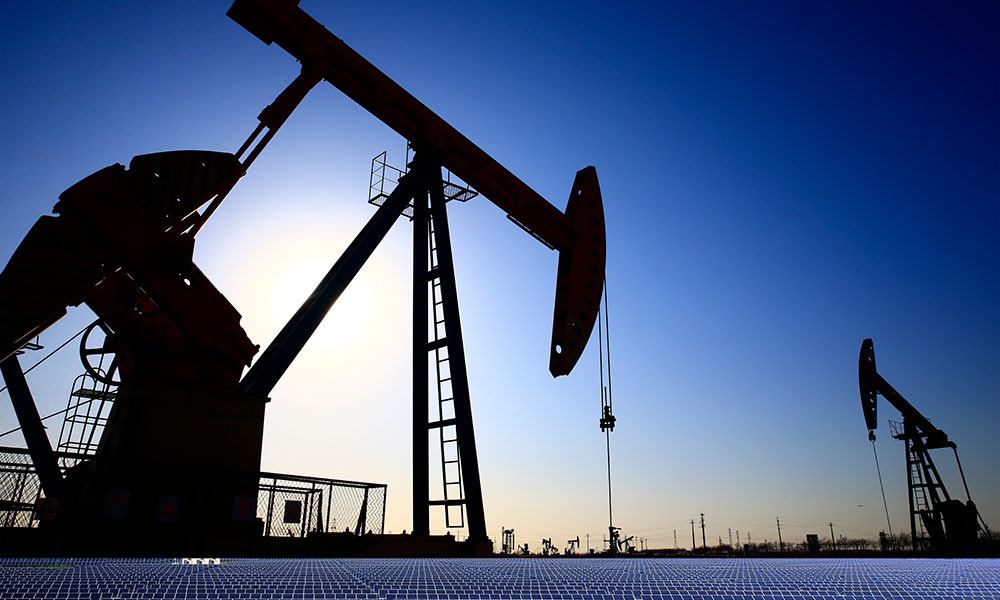
Texas leads the nation in both energy production and energy consumption. In 2021, Texas produced more energy than any other state, accounting for almost 12 percent of the nation’s total net energy generation. During the same year, Texas was the largest producer of oil (43 percent), natural gas (25 percent) and wind-powered electricity (26 percent) in the nation.
Many renewable energy facilities are planned and underway in the state,
but we may not see the benefit of those projects for decades to come.
Even with such immense energy production capabilities, the current Texas electricity infrastructure, for example, is unable to transmit and store all the electricity generated by renewable energy sources, including wind and solar. Indeed, many renewable energy facilities are planned and underway in the state, but we may not see the benefit of those projects for decades to come.
Given the energy demands of such a populous state, renewable sources alone are not up to the task of bearing the load. Texas needs a diverse energy portfolio that includes traditional oil and gas resources to ensure the state has access to sustainable, cost-effective energy production.
Electricity 101: How Electricity Gets to You
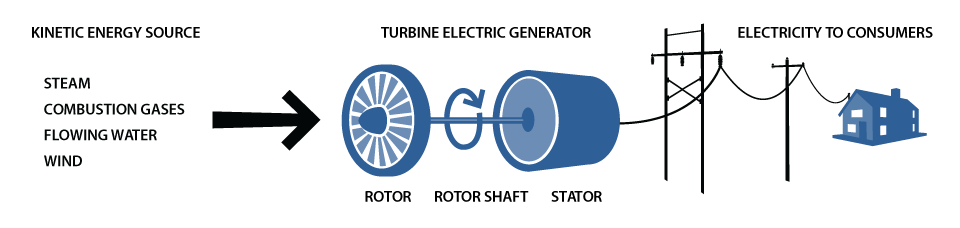
Energy is all around us and can be harnessed and converted into different forms depending on the intended use. Thermal, hydro, solar and wind energies can all be utilized to produce electricity and power our world. Most power plants in Texas and around the world generate electricity using steam turbines or, more recently, combustion turbines, powered by fuels such as natural gas. These turbines use steam or high-pressured gas to spin the rotor blades that, in turn, generate electricity.
ELECTRICITY GENERATION FROM AN ELECTRIC TURBINE
Source: U.S. Energy Information Administration
Wind-energy-powered turbines use wind, rather than steam or gas, to rotate the blades that power the electricity-generating turbines. Solar photovoltaic cells convert sunlight directly into electricity.
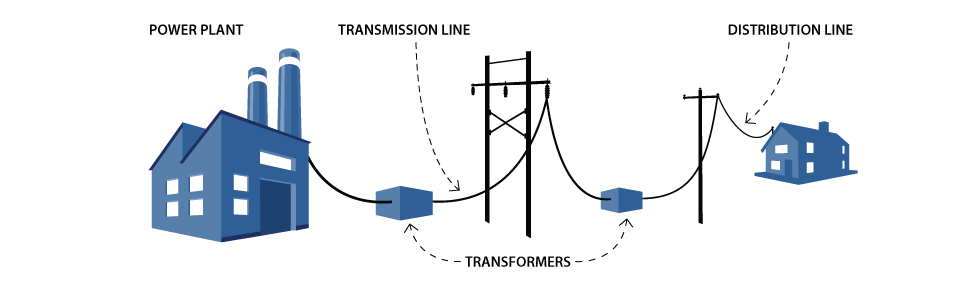
Once electricity is generated, it needs to be transmitted, distributed and used immediately, as it cannot be easily stored. To get the generated electricity from the remote areas in which it is typically generated to the more populous areas where it is needed, electricity is moved through transmission lines and delivered to consumers via a network of distribution lines. Transmission lines are a vital component of the electricity market for linking generators to consumers.
TRANSPORTING ELECTRICITY
Source: National Energy Education Development
Texas’ Current Energy Needs and Capabilities
Access to reliable energy sources ensures that the Texas electricity grid operates smoothly and continuously. Grid operators must anticipate real-time electricity demands and adjust quickly to deviations. For the most part, load demand follows a consistent pattern, but extreme weather conditions like a particularly hot summer or severe winter storm can strain the grid.
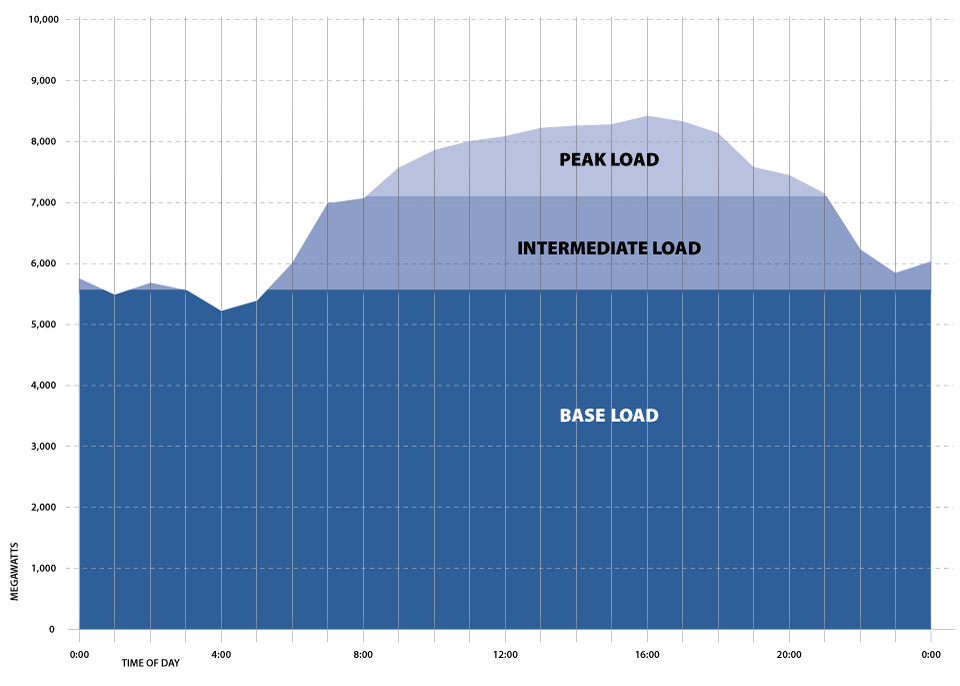
To meet projected demand, grid operators calculate the hourly predicted electricity demand over a 24-hour period, along with the availability of energy sources to meet that need in what is known as an electric load curve (Exhibit 1). The base load refers to the minimum amount of electricity needed during that period and is fueled by the most reliable and affordable energy sources. Other sources are then utilized to fulfill the difference during peak load demand, the period of highest demand (i.e., the hottest part of the day), and intermediate load, the period when demand is between base and peak loads. Proper load management ensures that consumers don’t experience service disruptions or exorbitant electricity bills.
EXHIBIT 1: EXAMPLE OF BASE, INTERMEDIATE AND PEAK LOADS DURING A 24-HOUR PERIOD
Note: Numbers are meant to illustrate usage and are not representative of actual data.
Source: Institute for Energy Research
Wind and solar power are self-limiting electricity generators, in that they are subject to Mother Nature, with wind energy tending to peak in the evening and early morning and solar energy peaking in the afternoon. Given a lack of significant long-duration storage and the increasing number of new generators among both traditional and renewable sources, a more robust transmission infrastructure is necessary to bring the energy to where it needs to be since it must be moved and utilized as soon as it is generated.
The Electric Reliability Council of Texas (ERCOT), the state’s electric grid operator, currently manages an electricity infrastructure (PDF) consisting of more than 1,030 generating units and almost 53,000 miles of high-voltage transmission lines. But that infrastructure is unable to bring all the electricity generated by renewable fuel sources to the areas in need of electricity, and even if it could, renewables alone couldn’t meet the demand for energy in Texas. ERCOT’s breakdown of energy use by fuel source in 2021 consisted of 61 percent fossil fuel sources, 28 percent wind and solar sources and the remainder from a combination of other sources (Exhibit 2). A diverse Texas energy profile is needed to ensure demand is met and that the electric load curve is maintained.
EXHIBIT 2: ENERGY USE BY FUEL SOURCE, 2021
Source
Percentage Generated
Fossil Fuels (natural gas and coal)
61%
Wind
24%
Nuclear
10%
Solar
4%
Other
5%
Note: Figures may not sum due to rounding.
Source: ERCOT
What About Wind and Solar?
For the last decade and a half, Texas has led the nation in wind-powered electricity generation, producing nearly 26 percent of the U.S. wind energy in 2021. The state’s vast and diverse geography makes it a leader in solar-generation potential as well. But with all that generating capability, if the electricity can’t flow to places it’s needed, it’s lost.
Wind and solar generators across the state have been asked by ERCOT to initiate curtailment — essentially, to reduce output below the maximum generation capacity when generation exceeds transmission capacity. Curtailment prevents transmission congestion caused by grid constraints and helps to avoid overloads.
There are simply not enough transmission lines to move all the wind- and solar-generated electricity to the customers that need it.
Transmission lines can take eight to 10 years to build and require significant capital investment. Increasing energy capacity in any sector is not as simple as just increasing production. In a recent interview with Bloomberg, Chevron Corp. CEO Mike Wirth said that “we’re looking at committing capital 10 years out.”
Planning and investing in a balanced approach to the energy market allows for a variety of energy sources to be utilized, given the inevitability of changing supply and demand.
External Energy Factors
Outside factors can affect the energy industry, increasing volatility in the market. The Russian invasion of Ukraine has had cascading consequences on the energy industry. Before the war, Russia supplied around 40 percent of Europe’s natural gas imports and 30 percent of its oil imports. Also, much of Europe has faced historically high temperatures this summer and has seen both the demand and price of natural gas skyrocket. Germany, for instance, recently announced plans to restart retired coal-powered electricity plants to meet demand. Furthermore, in July, members of the European Union voted to include natural gas on the list of sustainable activities to increase energy production for its members.
The war in Ukraine has affected natural gas availability and its price in the U.S. as well. In Texas, natural gas prices have increased more than 66 percent from January to July of this year, resulting in higher utility bills for many customers across the state. Texas is a leader in natural gas production, consumption and exporting, with nearly half of all U.S. liquified natural gas (LNG) exports flowing through Texas terminals in 2020. Nearly 75 percent of U.S. LNG was exported to Europe during the first four months of 2022, an increase from the annual average of 34 percent, according to the U.S. Energy Information Administration, making clear the continued and rising need for Texas LNG abroad.
What Texas is Doing
Texas has come a long way in diversifying its energy portfolio over the last decade (Exhibit 3).
Given the state’s current generating and production capacities, along with the current transmission infrastructure, it is not feasible to “flip a switch” and transition to 100 percent renewable energy overnight, says Texas Comptroller Glenn Hegar in an editorial piece published in The Dallas Morning News. Many sectors of manufacturing, such as the auto industry and petrochemical and plastics production industry, are dependent on oil and gas to use equipment that doesn’t operate on renewable energy.
EXHIBIT 3: ERCOT GENERATION FUEL MIX, 2011-2021
Natural Gas
Wind
Coal
Nuclear
Solar
Other
2011
40%
8.5%
39.2%
11.9%
n/a
0.4%
2012
44.7%
9.2%
22.8%
11.9%
n/a
0.2%
2013
40.7%
9.9%
37.4%
11.6%
0.05%
0.22%
2014
41.2%
10.7%
36.1%
11.6%
.08%
0.32%
2015
48.3%
11.7%
28,1%
11.3%
n/a
0.6%
2016
43.6%
15.1%
28.7%
11.9%
0.24%
0.46%
2017
39%
17%
32%
11%
0.6%
0.4%
2018
44%
19%
25%
11%
0.8%
0.2%
2019
47%
20%
20%
11%
1.8%
0.2%
2020
46%
23%
18%
11%
2.0%
n/a
2021
44%
29%
19%
10%
4%
5%
Note: Figures may not sum due to rounding.
Source: ERCOT
Texas has enormous potential for energy production and electricity generation, but increased investment in the state’s electricity infrastructure, including transmission lines, is critical. It is difficult to estimate the cost of that investment but using a baseline such as the Competitive Renewable Energy Zone, at $2,500 per MW-mile (PDF), it’s reasonable to conclude a significant capital investment would be necessary.
Energy and Technology Go Hand-in-Hand
The demand, supply and capabilities of Texas’ energy industries will grow along with technology, innovation and investment. But time is needed for that growth, and the Comptroller has pointed out that fossil fuels will remain a crucial part of the energy mix for the foreseeable future. The importance of oil and gas goes beyond generating electricity. The U.S. Department of Energy lists thousands of products that are manufactured with the use of petrochemicals — from heart valves to water pipes to wind turbine blades. Petroleum is a component of many products that we use every day, including the parts that make electric and traditional vehicles lighter in weight and more efficient.
“We must work together to advance timely, practical solutions that develop renewable energy, while acknowledging the continued importance of a diversified energy portfolio. Our economic health and well-being depend on it,” says Comptroller Hegar. FN
To learn more about the related subject of gas prices, tune in to the September Fiscal Notes video. Check out the full playlist.