Skip navigation

Top navigation skipped
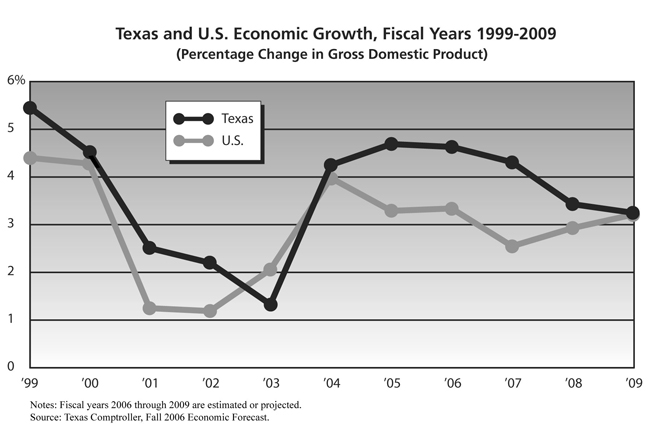
Figure 2
Biennial Revenue Estimate, 2008-2009
Economic Outlook
Texas Economy on a Roll, But a Slowdown Coming
Over the past two years, the Texas economy experienced its strongest economic growth since the high-tech boom of 1998-99. In fiscal 2005 and 2006, inflation-adjusted gross state product (GSP) grew at an average annual rate of 4.7 percent; and Texas non-farm employment rose at the relatively robust rate of 2.5 percent per year. (See Table 1 and Figure 2.) Propelled by rising employment and wages, statewide personal income registered a strong 7.5 percent average annual growth rate over 2005-06. In tandem, the state's population — boosted by the inflow of an estimated 150,000 post-Katrina Gulf Coast evacuees in early fiscal 2006 — grew 1.8 percent in fiscal 2005 and 2.7 percent in fiscal 2006 — the latter increase a 23-year high.
Table 1 - Texas Economic History and Outlook for Fiscal Years 1999-2009 - Fall 2006 Forecast
Texas Economy
| 1999 | 2000 | 2001 | 2002 | 2003 | 2004 | 2005 | 2006* | 2007* | 2008* | 2009* | |
|---|---|---|---|---|---|---|---|---|---|---|---|
| Gross State Product (Billions, 2000 $) |
$691.3 | $722.6 | $740.8 | $757.1 | $767.2 | $799.8 | $837.3 | $876.1 | $913.8 | $945.2 | $975.9 |
| Annual Percentage Change in Gross State Product |
5.4 | 4.5 | 2.5 | 2.2 | 1.3 | 4.3 | 4.7 | 4.6 | 4.3 | 3.4 | 3.2 |
| Personal Income (Billions, Current $) |
530.3 | 581.3 | 615.6 | 624.0 | 642.9 | 678.3 | 730.0 | 784.0 | 836.6 | 889.1 | 945.8 |
| Annual Percentage Change in Personal Income |
6.5 | 9.6 | 5.9 | 1.4 | 3.0 | 5.5 | 7.6 | 7.4 | 6.7 | 6.3 | 6.4 |
| Nonfarm Employment (Thousands) |
9,106.4 | 9,360.6 | 9,530.8 | 9,426.6 | 9,375.2 | 9,450.3 | 9,665.4 | 9,931.1 | 10,126.9 | 10,345.4 | 10,539.4 |
| Annual Percentage Change in Nonfarm Employment |
2.8 | 2.8 | 1.8 | (1.1) | (0.5) | 0.8 | 2.3 | 2.7 | 2.0 | 2.2 | 1.9 |
| Resident Population (Thousands) |
20,507.6 | 20,900.6 | 21,286.4 | 21,673.3 | 22,051.9 | 22,426.5 | 22,835.0 | 23,444.0 | 23,843.5 | 24,310.9 | 24,761.2 |
| Annual Percentage Change in Resident Population |
2.0 | 1.9 | 1.8 | 1.8 | 1.7 | 1.7 | 1.8 | 2.7 | 1.7 | 2.0 | 1.9 |
| Unemployment Rate (%) | 4.7% | 4.4% | 4.4% | 6.1% | 6.7% | 6.2% | 5.4% | 5.1% | 5.3% | 5.3% | 5.2% |
| Oil Price (per Barrel) | 12.91 | 25.16 | 23.73 | 21.90 | 28.60 | 32.48 | 46.88 | 61.12 | 56.95 | 54.97 | 52.15 |
| Natural Gas Price (per Mcf) | $1.82 | $2.82 | $4.21 | $2.44 | $4.02 | $4.48 | $5.44 | $7.06 | $6.02 | $6.48 | $6.42 |
U.S. Economy
| 1999 | 2000 | 2001 | 2002 | 2003 | 2004 | 2005 | 2006* | 2007* | 2008* | 2009* | |
|---|---|---|---|---|---|---|---|---|---|---|---|
| Gross Domestic Product (Billions, 2000 $) |
$9,361.9 | $9,762.8 | $9,885.1 | $10,002.4 | $10,208.3 | $10,614.5 | $10,963.4 | $11,329.2 | $11,618.4 | $11,958.8 | $12,342.8 |
| Annual Percentage Change in Gross Domestic Product |
4.4 | 4.3 | 1.3 | 1.2 | 2.1 | 4.0 | 3.3 | 3.3 | 2.6 | 2.9 | 3.2 |
| Consumer Price Index (1982-84 = 100) |
165.5 | 170.7 | 176.2 | 178.9 | 183.1 | 187.3 | 193.5 | 200.7 | 206.3 | 210.3 | 214.6 |
| Annual Percentage Change in Consumer Price Index |
1.9 | 3.2 | 3.2 | 1.5 | 2.4 | 2.3 | 3.3 | 3.7 | 2.8 | 1.9 | 2.0 |
| Prime Interest Rate (%) | 7.9% | 9.0% | 8.0% | 4.9% | 4.2% | 4.1% | 5.7% | 7.6% | 8.4% | 7.8% | 7.9% |
* Estimated or projected.
SOURCES: Susan Combs, Texas Comptroller of Public Accounts; and Global Insight, Inc.
By way of comparison, in 1998-99, inflation-adjusted GSP grew at a somewhat higher 5.7 percent annual average, but population growth, at 2.1 percent annually, was slightly lower than the 2.2 percent per year registered during 2005-06. (See Figure 1.) Just two biennia earlier, in fiscal 2002-03, inflation – adjusted GSP grew at an average annual rate of only 1.8 percent, while non-farm employment declined by more than 155,000 jobs.
Turning to the future, Texas economic growth is expected to lose some of its steam over the three-year period 2007-09, as the U.S. economy decelerates and the state's high-rolling energy and construction sectors settle into more modest and sustainable growth rates. In fiscal 2007, real GSP growth is expected to ease to 4.3 percent and then fall to an even more moderate 3.3 percent average annual rate for the 2008-09 biennium.
Non-farm employment growth is expected to average only about 2 percent per year over the next three years, and personal income growth should fall below 6.5 percent per year in fiscal 2008 and 2009. State population growth is expected to decline briefly to 1.7 percent in fiscal 2007 and then return to an average of 1.9 percent per year in 2008-09.
Figure 2
The convergence of three important factors — a thriving national economy, the boom in housing and construction, and a surge in energy prices — fueled the strong performance of the Texas economy over the past two years. Unfortunately, the economic good-times that the state has been enjoying seem destined to end, as the same factors that propelled the economic boom in 2005-06 are expected to stall in fiscal 2007 through fiscal 2009.
U.S. Economy and Manufacturing Slowing
Because of relatively strong consumer and business spending, the national economy expanded at a solid 3.3 percent average annual growth rate over 2005-06. Robust national economic growth benefits Texas manufacturers, particularly those who sell their products in national and worldwide markets. Thus, after declining for six consecutive years, statewide manufacturing employment increased at an average annual rate of 0.8 percent over 2005-06. Although this rate of employment growth may appear relatively low, after factoring in manufacturing's strong productivity gains, it translates into manufacturing output growth averaging just over 9 percent per year during the period.
In contrast, from fiscal 2007 through fiscal 2009, the national economy is expected to decelerate as households nationwide retrench from their free-spending, historically high recent consumption levels, and as the overheated housing market sours in the Northeast, Florida, and the West Coast. In Texas, job growth has already slowed from a year-over-year peak of almost 3 percent in November 2005 to 2.2 percent in October of 2006 — a decline on the order of 25 percent. And, even though real wages have risen because of the state's tight labor market, as statewide employment growth continues to fall, disposable personal income growth — the major driver of consumer spending — should also lose momentum.
The escalation of house prices over the past several years not only made homeowners feel wealthier, it put additional cash in their hands by allowing them to "cash out" directly or draw on their equity indirectly via home equity loans and other financial tools. During the recent housing boom, U.S. net "mortgage equity withdrawals" from cash-out refinancing, home equity loans, and capital gains from home sales (after closing costs) quadrupled — from $200 billion in calendar 2000 to an annual rate of $870 billion in the third quarter of 2005. As housing markets have cooled, however, the total has fallen by almost 60 percent — to an annual rate of $380 billion in the third quarter of 2006.
Largely because of rising household debt levels, the national personal savings rate actually fell below zero (to -0.4 percent) in 2005 — the first time since the Great Depression. Since then, the U.S. savings rate has fallen farther, to an average of -1.4 percent in the second and third quarters of 2006. Although consumer expenditures can rise above disposable income temporarily when consumers have the ability to draw on the increasing values of their homes and other wealth, eventually the two must fall in line. This means that some rebuilding in household savings — and retrenchment of consumer spending — can be expected, especially as the financial gains from rising house prices become less available.
Because of these factors, it is forecast that the growth of national inflation-adjusted consumer expenditures — which account for 70 percent of U.S. Gross Domestic Product (GDP) — will decline to an estimated average annual rate of 2.7 percent at the national level in the fourth quarter of 2006. As recently as the second quarter of calendar 2005, the annual growth rate was 4.2 percent. More dramatically, as national home sales, prices, and construction have fallen and the inventory of unsold homes increased, U.S. residential investment has plummeted from an annualized gain of 20.0 percent to an annualized decline of 21.3 percent over the same period — a swing of 41.3 percent. Moreover, as housing sales fall, consumer expenditures on furniture, electronics, floor coverings and other housing-related items will drop in turn.
Despite an improvement in net exports, growth in inflation-adjusted U.S. GDP is expected to fall from 3.3 percent in fiscal 2006 to 2.6 percent in fiscal 2007 — a 21 percent drop. Thereafter, inflation-adjusted GDP is expected to increase by 2.9 percent in fiscal 2008 and 3.2 percent in fiscal 2009.
As U.S. economic growth slows, Texas manufacturing and statewide manufacturing can be expected to follow suit, albeit with a lag of one to two quarters because of some residual strength in the local energy and construction sectors. Texas manufacturing employment should rise by another 0.9 percent in fiscal 2007 before dropping at a 0.5 percent average annual rate over 2008-09.
The Peak Appears Over for the Texas Energy Sector
In 2005-06, the run-up in worldwide oil and natural gas prices reawakened the state's relatively dormant energy industry. From a low of $21.90 per barrel in fiscal 2002, the average taxable price of Texas oil almost tripled, climbing to $61.12 in fiscal 2006. During the same period, the average taxable price of natural gas also nearly tripled — from $2.44 per Mcf in fiscal 2002 to $7.06 in fiscal 2006.
Responding to the high prices, statewide oil and gas exploration and development activity surged, pushing the Texas rotary rig count up to an average of 692 in fiscal 2006 — the state's highest level since 1985. As part of this mini "energy-boom," Texas mining employment increased by 7.3 percent in fiscal 2005 and by another 6.0 percent in fiscal 2006. And even though oil- and gas-related industries, which include refining, chemicals, and oil-field machinery, account for only 2.9 percent of statewide employment, their high-wage, high-productivity jobs make the energy sector one of the state's more important industries, accounting for 12.0 percent of statewide economic output in 2005, the most recent year for which data are available.
In the summer of 2006, however, world oil and natural gas prices started to fall; and they are expected to slide even more through fiscal 2009 as global economic growth eases and concerns of political and climatic energy-supply interruptions recede. In fiscal 2006, the taxable price of Texas oil peaked at $69.82 per barrel in July before falling to $54.92 per barrel in October — the second month of fiscal 2007. Similarly, the taxable price of Texas natural gas peaked at $9.66 per Mcf in October 2005, but by October 2006 the price was down to $5.11.
The taxable price of Texas oil will fall from an average of $61.12 per barrel in fiscal 2006 to $52.15 in fiscal 2009. During the same period, taxable natural gas prices are expected to decline from $7.06 per Mcf in fiscal 2006 to $6.48 and $6.42 in fiscal 2008 and 2009, respectively. Falling energy prices will push the Texas rotary rig count down to 611 by fiscal 2009 and erase much of the recent job gains in the sector. Even with these declines, however, the Texas rig count should remain well over its 2002 low of 353 for the foreseeable future. Consequently, statewide, mining employment is expected to increase by only 0.8 percent in fiscal 2007 and then decline at a 1.9 percent average annual rate over 2008-09.
Texas Housing and Construction Expected to Slow
Low mortgage rates, relatively affordable housing prices, and strong employment and population growth, in combination with reviving office and commercial real estate markets, allowed construction activity in Texas to boom in 2005-06. Statewide single-family and multi-family housing construction reached a 22-year high of 212,065 units in fiscal 2006, while non-residential construction-put-in-place increased by 13.2 percent. Strong residential and nonresidential construction activity increased total construction employment in Texas by 2.6 percent in fiscal 2005 and by another 5.5 percent in fiscal 2006.
Over the next three years, however, construction activity should lose momentum as the cost of owning or renting a home in Texas pushes closer to the national average. Recent figures from the U.S. Bureau of the Census indicate that rising home values and mortgage rates have significantly increased the cost of owning a home in this state. From 2000 to 2005, the percentage of Texas mortgage holders who carried total housing costs (including mortgage payments, taxes, insurance, utilities and homeowner fees) of more than 30 percent of their income increased by 10 percentage points — from 22.4 percent to 32.4 percent — just below the national average of 34.5 percent. That said, Texas still remains well below California, where 47.7 percent of households spend more than 30 percent of their household income on housing, as well as New Jersey (40.7 percent), Florida (40.6 percent) and New York (38.9 percent).
Slowing economic activity, higher interest rates, and overbuilding in many major markets have transformed the housing boom to a housing bust in many parts of the country. Even as Texas housing markets have so far avoided this condition, signs of wear have begun to pop up. In March 2006, the three-month moving average of the number of statewide housing sales was up by a healthy 14.3 percent, while the number of listings of houses available for sale was down by 7.4 percent over the previous year. Six months later, in October 2006, the situation had changed dramatically. The year-over-year increase in statewide housing sales had fallen to only 4.4 percent, while the number of houses listed as available for sale was up by 8.9 percent over the previous year.
As Texas housing sales weaken and listings rise, housing prices and new construction activity can be expected to suffer. From its peak in January, through October of 2006, the year-over-year increase in the sales price of the average Texas home fell from 8.8 percent to just 3.6 percent, while at the same time — and perhaps most dramatically — the number of permits filed to build new homes in the state fell from 20.7 percent above the previous year's level to 12.4 percent below .
Following the slump in national housing construction and the recent decline in new Texas housing permits, statewide housing starts are projected to decline by 13 percent in fiscal 2007, 8 percent in 2008, and another 2 percent in 2009. Over this three-year period, statewide nonresidential construction activity should stay relatively flat, as gains in office construction negate losses in retail and other commercial construction, and housing starts decline — sharply at first, then more slowly. Overall, total Texas construction employment is expected to still show a 4.2 percent gain in fiscal 2007, and then decelerate more quickly, ending the biennium with only a 1.6 percent gain in fiscal 2009.
Services Expected to Account for the Bulk of New Jobs
As has become customary, service-providing industries can be counted upon to generate the bulk of the state's new jobs over the next three years. The service sector (which includes retail and wholesale trade; transportation, warehousing, and utilities; finance, insurance, and real estate; government; and business, professional, health, education, information, and leisure and hospitality services) accounted for approximately 83 percent of the state's total non-farm employment and number of new jobs in 2005-06. But as employment growth in the goods-producing industries (which include oil and gas, construction, and manufacturing) slows almost to a crawl in 2008-09, an even higher 97 percent of the new jobs during the biennium will be created by the state's service sector.
Overall, service-providing employment will increase by a total of 562,400 jobs over the three-year period 2007-09; and about two-thirds of these job gains are expected to arise in three categories: professional and business services; trade, transportation, and utilities; and education and health services.
Employment in professional and business services is expected to increase by 132,400, largely driven by business demands for accounting and payroll, computer design, architectural and engineering, employment and management, security, and building services. Employment in trade, transportation, and utilities is expected to increase by 127,000, mainly because of continuing job growth in the retail and wholesale trade sectors.
Finally, employment in education and health services is expected to increase by 109,100, driven by the state's expanding school-age population and the growing number of baby boomers reaching their retirement years. Increasing technological advances in medical services can be expected to exert an additional upward force for job growth in education as well as health services. Most of the remaining employment gains are expected to show up in leisure and hospitality services, in response to increasing business and household needs for hotels and restaurants.
Forecast Risks
Although the outlook is generally positive, at least three major interrelated factors could lead to significantly lower state economic growth over the next several years.
First, and by far the most important, a spike in interest rates could trigger a larger than expected downturn in the U.S. and Texas housing markets and significantly reduce state economic growth. If the Federal Reserve Board determines that it must accelerate its fight against inflation by imposing additional increases in short-term interest rates, many homeowners, particularly those holding adjustable-rate mortgages, could be forced to refinance into longer-term mortgages at higher rates. And, if inflation remained relatively high (rather than dropping, as expected, because of lower energy prices), long-term bond and mortgage rates could also increase, putting additional costs on homeowners and potential new homebuyers.
Second, in addition to its especially deleterious effect on housing, a sustained increase in short- and long-term interest rates could further slow U.S. and Texas economic growth in other sectors. Higher interest rates make it more expensive for households to purchase cars, trucks, appliances, and other big-ticket items on credit. And as the cost of borrowing rises, business purchases of computers and other hardware could also be hurt.
Third, political or other significant disruptions in world oil supplies could lead to a sharp increase in world oil prices. Although perhaps initially beneficial to the Texas energy industry, such high prices, if sustained, would eventually reduce economic growth in the United States and other net oil-consuming nations in the world. The resulting loss in U.S. economic growth and consumer confidence would then likely overwhelm the initial positive impact of the higher energy prices on the state economy.