Skip navigation

Top navigation skipped
High-Cost Natural Gas Tax Rate Incentive Study
Rider Element A
Rider Element A: Provide criteria for evaluating the effectiveness of the high-cost natural gas tax rate reduction program.
Many criteria could be used to evaluate the effectiveness of a tax or tax exemption provision, such as the high-cost natural gas tax rate reduction program. Such criteria could include, but are not limited to, the following: the manner of natural gas taxation in other states; the adequacy of natural gas production tax revenue with the high-cost natural gas tax rate reduction included and with the resulting revenue collection reductions; the equity of the high-cost rate reduction among all similarly-situated natural gas production taxpayers; and the economic efficiency of the high-cost tax rate reduction provision.
Taxation in other states: Currently, 35 states impose severance taxes on oil and natural gas production, of which three (Idaho, North Carolina and Wisconsin) have no production of those minerals. The states of California and Pennsylvania are major producers of oil and natural gas but tax neither type of production. New York and Virginia are major producers of natural gas, but have no state severance tax provisions. With respect to natural gas, the following table on page 7 shows states with some level of natural gas production in 2013 and the conventional tax rate for natural gas production.
The Texas high-cost tax rate incentive may not be perceived as favorably as the incentive granted by California and Pennsylvania in that neither has a state natural gas severance tax. Also, the Texas incentives for high-cost natural gas wells may not be as generous as those granted by three states surrounding Texas. In a study prepared for the Oklahoma Policy Institute, Headwaters Economics concluded that Texas' effective tax on an unconventional natural gas well was greater than the effective tax rate for Arkansas, Louisiana and Oklahoma. That study also found that Wyoming and New Mexico provided no incentives for the drilling of unconventional natural gas wells5.
| State | Marketed Production in 2013 (MCF) | Share of U.S. Total | Current State Conventional Tax Rate |
|---|---|---|---|
| Texas | 7,545,401,000 | 30.9% | 7.5% of market value |
| Pennsylvania | 3,259,042,000 | 13.4% | None |
| Louisiana | 2,406,834,000 | 9.9% | 1Jul2013 to 30Jun2014 - 11.8 cents/MCF; 1Jul2014 to 30Jun2015 - 16.3 cents/MCF |
| Oklahoma | 2,143,999,000 | 8.8% | 7.0% of gross market value. Wells spudded after 1Jul2015 taxed at 2% for 1st 36 production months. |
| Wyoming | 1,858,207,000 | 7.6% | 6.0% on value |
| Colorado | 1,604,860,000 | 6.6% | 2.0 to 5.0% based on gross income from production |
| New Mexico | 1,195,431,000 | 4.9% | 3.75% of value |
| Arkansas | 1,139,654,000 | 4.7% | 5% of market value |
| West Virginia | 717,892,000 | 2.9% | 5% of gross value |
| Utah | 470,863,000 | 1.9% | 3% for first $1.50/MCF and 5% for value in excess of $1.50/MCF |
| Alaska | 338,182,000 | 1.4% | Current rate of 35% based on net value of oil and gas, which is the value at point of production less certain qualified expenditures |
| Kansas | 292,467,000 | 1.2% | 8.0% of gross value |
| California | 252,310,000 | 1.0% | None |
| North Dakota | 235,711,000 | 1.0% | For fiscal year 2013-2014, 8.33 cents per MCF |
| Alabama | 196,326,000 | 0.8% | 8% of gross value at point of production |
| Ohio | 186,181,000 | 0.8% | 2.5% of gross wellhead receipts |
| Virginia | 139,382,000 | 0.6% | None |
| Michigan | 123,622,000 | 0.5% | 5.0% of gross cash market value |
| Kentucky | 94,665,000 | 0.4% | 4.5% of gross value |
| Montana | 63,242,000 | 0.3% | Varies for different well types/over differing production horizons |
| Mississippi | 59,272,000 | 0.2% | 6.0% of value at point of production |
| New York | 23,458,000 | 0.1% | None |
| South Dakota | 16,205,000 | 0.1% | 4.5% of gross value less royalties |
| Indiana | 7,938,000 | 0.0% | 1.0% of value |
| Tennessee | 5,400,000 | 0.0% | 3.0% of sales value |
| Illinois | 2,887,000 | 0.0% | None |
| Nebraska | 1,032,000 | 0.0% | 3.0% of gross value |
| Oregon | 770,000 | 0.0% | 6% of gross value at wellhead |
| Florida | 292,000 | 0.0% | 30.4 cents per MCF, adjusted annually |
| Arizona | 72,000 | 0.0% | 3.125% of gross value of production |
| Maryland | 32,000 | 0.0% | None |
| Nevada | 3,000 | 0.0% | Sliding rate from 2 to 5% of net value of production |
Source: U.S. Energy Information Administration
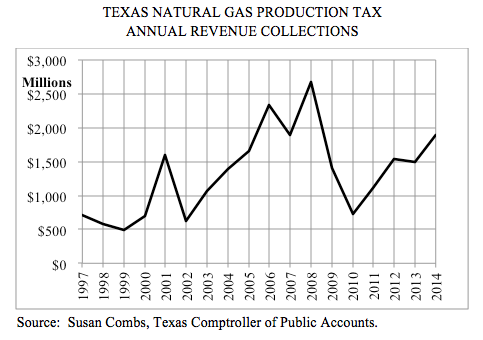
Adequacy: With the high-cost natural gas tax rate reduction provision in place, annual natural gas production tax revenue has risen from $712 million (accruing to all funds, General Revenue as well as the Economic Stabilization Fund) in fiscal 1997 to $1,900 million in fiscal 2014. Over those 18 years the trend has been, in general, consistently upward, although with a large degree of variation. While collections would have been greater without the high-cost provision, overall revenue figures do not generally display a long-term downward trend.
Equity: All natural gas production taxpayers who are similarly-situated — that is, have a natural gas well meeting the high-cost standards of the Texas Railroad Commission — receive a reduced tax rate. The amount of that reduction varies with the relationship between the median drilling costs for all high-cost wells and the drilling costs of a particular well, such that the higher the relative total drilling cost for that particular well the more the tax rate is reduced. Further, a taxpayer receives the reduced tax rate for no more than 10 years, or until such time as the tax reduction realized becomes equal to one-half of the cost of drilling the well. A very high producing well might receive the rate reduction for less than 10 years while a low producing high-cost well might receive the rate reduction for the full 10 years allowable under statute.
Economic Efficiency and Incentives: The existence of the reduced tax rate for high-cost natural gas wells in Texas could have the effect, likely in concert with other economic and financial factors facing a producer, of increasing the number of such wells drilled in Texas by providing an incentive.
There appears to be a correlation between higher prices for natural gas and increased production. Natural gas prices averaged $2.42 per MCF in fiscal 1997, rising to $8.47 for 2008 prior to the last recession, then falling to $4.17 for 2014. During that period the high-cost natural gas share of total state natural gas production went from 3 percent in 1997, to 62 percent in both 2011 and 2012, then falling to 46 percent for 2014.
With lower prices seen in recent years, the stability in production could partially be attributed to gains in technology which seem to provide higher initial and overall production rates for newly drilled wells. Additionally, production has remained stable owing to rapid gains in associated gas (casinghead gas) coming from oil well activity.
Exploration activity in Texas moved away from the Barnett Shale (a natural gas play) toward the Eagle Ford Shale (primarily an oil play) concurrent with natural gas prices falling in late 2008, and remaining at lower levels. While oil prices also fell in 2008, they quickly rose into the $80 range and continued to rise. Observing this movement from predominately natural gas exploration to that for oil, one might infer from those changes that economic factors outweighed other possible considerations, including this incentive.
- 5 http://headwaterseconomics.org, “Unconventional Oil and Natural Gas Production Tax Rates: How Does Oklahoma Compare to Peers,” page 3.