Skip navigation

Top navigation skipped
High-Cost Natural Gas Tax Rate Incentive Study
Rider Element C
Rider Element C: Detail the range of natural gas prices at which the rate reduction incentivizes natural gas production.
Higher market prices are clearly a factor in incentivizing the drilling of natural gas wells. While price is a factor there are other contributing factors such as geological formations, lease cost, contractual obligations to supply natural gas, type of natural gas (dry gas only, or with significant natural gas liquids), anticipated drilling and completion costs, anticipated initial/overall production, available pipeline infrastructure, and a host of other factors.
Among those cost considerations is the state's natural gas production tax. As a tax on value, the factor of greatest importance would ordinarily be the price of natural gas produced. And, as a tax on the value of production, it acts to reduce the producer's overall revenue from exploration efforts by 7.5 percent. A high-cost well with a tax rate of 1.5 percent, for example, would of course see lower taxes due. This holds true whether natural gas prices were to be $4, $6 or $8 per MCF. The incentive could be of greater importance when a producer's decision whether to drill, or not, is a close one and the incentive becomes a determining factor.
Another factor in considering price ranges and the degree to which these affect decision making is the alternative available to producers: drill for natural gas or drill for oil. Some producers are set up to explore for one of these hydrocarbons, utilizing their skill set, and they do not drill outside of those boundaries. However, many producers most likely can, and do, alternate between exploring for oil and exploring for natural gas based on prevailing conditions such as price and the attractiveness of a play.
In the early- to mid-2000s period, when the Barnett Shale was recognized as a gas-rich play, rapidly rising natural gas prices together with the improved hydraulic fracking technologies steered producers toward natural gas exploration. In contrast, just a few years later natural gas prices plummeted and did not significantly recover. However, oil prices did recover, the Eagle Ford Shale area opened, and the fracking technology was extended to apply to oil exploration. At that time, producers began to move away from natural gas to oil.
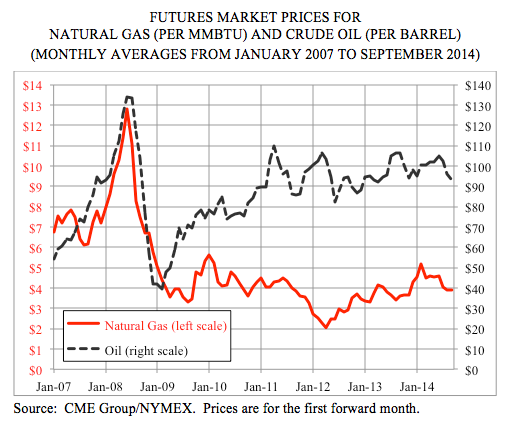
Historically, and in general terms, the market price for a barrel of oil was around 10 times the market price for a thousand cubic feet (MCF) of natural gas. But since the market prices for those products bottomed out in early 2009, that ratio has climbed, reaching a monthly average level of 50-to-1 in April 2012. Over the last two years the average ratio was above 20-to-1. The following chart demonstrates these recent changes in relative market prices.
As shown in the following table, in 2009 on average there were 467 natural gas drilling rigs operating in Texas, compared to only 125 rigs drilling for oil. By 2014, the average number of natural gas rigs had fallen by 80 percent, to just 95; the number of oil rigs had increased by over 500 percent, to 765 (as noted later in this report, the natural gas drilling rig count during the week of October 31, 2014, stood at just 79).
| NG Fiscal Year | NG Fiscal Year Futures Market Price (per Mcf)* | NG Texas Total Production (Mcf)** | NG Texas Active Drilling Rigs*** | CO Futures Market Price (per barrel)* | CO Texas Total Production (barrels)** | CO Texas Active Drilling Rigs*** |
|---|---|---|---|---|---|---|
| 1997 | $2.42 | 5,899,222,683 | $22.27 | 492,901,597 | ||
| 1998 | $2.47 | 5,846,253,232 | $17.13 | 480,939,070 | ||
| 1999 | $2.06 | 5,700,889,620 | $14.95 | 422,418,950 | ||
| 2000 | $2.86 | 5,676,785,089 | $26.69 | 406,807,512 | ||
| 2001 | $5.41 | 5,797,502,307 | $29.71 | 388,456,273 | ||
| 2002 | $2.84 | 5,798,759,652 | $23.76 | 371,562,739 | ||
| 2003 | $4.79 | 5,735,382,403 | $30.10 | 361,244,557 | ||
| 2004 | $5.55 | 5,946,025,377 | $34.55 | 355,079,702 | ||
| 2005 | $6.53 | 5,995,180,877 | $50.32 | 350,064,265 | ||
| 2006 | $9.28 | 6,174,730,073 | $65.63 | 347,196,173 | ||
| 2007 | $7.07 | 6,553,346,102 | $63.51 | 344,230,659 | ||
| 2008 | $8.47 | 7,389,655,552 | $101.93 | 348,665,947 | ||
| 2009 | $5.96 | 7,864,960,645 | 467 | $64.09 | 352,784,355 | 125 |
| 2010 | $4.43 | 7,382,485,179 | 340 | $76.32 | 354,296,272 | 215 |
| 2011 | $4.20 | 7,656,342,683 | 350 | $91.26 | 403,516,589 | 428 |
| 2012 | $3.12 | 8,068,000,968 | 280 | $94.37 | 539,431,656 | 636 |
| 2013 | $3.47 | 8,193,179,261 | 152 | $93.65 | 701,769,367 | 692 |
| 2014 | $4.17 | 8,068,887,438 | 95 | $101.07 | 833,630,140 | 765 |
* CME Group/NYMEX. Prices are annual averages, for the first forward month. Mcf = thousands of cubic feet.
** Texas Railroad Commission
*** Baker Hughes Incorporated (annual averages; state-specific figures for the years 1997 to 2008 are unavailable)