Texas is growing fast, and unlike many other states, its young population is growing as well. According to U.S. Census Bureau data, one of every 10 persons under the age of 18 in the U.S. lives in Texas.
This is the first of a two-part series on young Texans. In this issue, we’ll take a look at what’s driving our state’s population growth and the demographic characteristics of young Texans. Next month, we’ll explore the educational landscape and job prospects for this growing segment of our population.
What Drives Population Growth
The Census Bureau estimated Texas’ total population at 29 million in 2019, and the Texas Demographic Center (TDC) projects it will rise to about 47.3 million by 2050. In addition to the “natural” increase driven by births, this surge is being driven by people attracted to Texas by our strong economy.
Thus, population growth in Texas is based on two elements: natural increase and net migration from other states and nations.
Natural increase occurs when the state’s birth rate is higher than its death rate. Natural increase is the primary source of Texas population growth, although it has declined somewhat in recent years — from nearly 213,600 additional residents in 2011 to about 175,900 in 2019 — according to Census Bureau estimates. Texas’ natural increase in 2019, however, ranked second only to California’s, the nation’s most populous state.
Net migration is the sum of domestic migration and international migration minus out-migration (i.e., those leaving the state). Since 2011, total net migration to Texas has varied, reaching a recent peak in 2015, receding sharply thereafter and then surging again in 2019 (Exhibit 1). Net domestic migration followed a similar pattern, falling sharply after 2015 and then coming back strongly, increasing by nearly 50 percent in 2019. International migration, meanwhile, has fallen by nearly 45 percent since 2015.
Even so, between 2010 and 2019, Texas saw the second-highest cumulative net migration among states, with more than 1.9 million new residents (Exhibit 2). In 2018 (most recent data available), Texas’ largest source of net domestic migration was California, with more than 48,000, followed by Florida, Missouri and Maryland.
Within the state, TDC projects the largest population increases around Texas’ thriving urban areas, as expected, but also in areas of West Texas and the Panhandle (Exhibit 3). Some areas of the Permian Basin region, in fact, are expected to see more than 300 percent population growth by 2050, driven largely by the area’s oil industry.
Exhibit 1: Elements of Population Growth in Texas, 2011-2019
Exhibit 1
Year
Natural Increase
Net International Migration
Net Domestic Migration
Total Migration
2011
213,583
69,059
120,672
189,731
2012
2208,912
84,959
141,740
226,699
2013
2205,821
79,798
107,657
187,455
2014
2203,609
107,045
160,260
267,305
2015
2214,427
117,660
172,048
289,708
2016
2212,171
110,866
120,910
231,776
2017
2197,199
98,188
84,790
182,978
2018
2177,745
71,278
83,795
155,073
2019
2175,878
65,044
125,660
190,704
Source: U.S. Census Bureau
Exhibit 2: Cumulative Net Migration, April 1, 2010, to July 1, 2019: Top and Bottom Five States
States with Highest Net Migration
Florida
2,396,653
Texas
1,964,386
North Carolina
639,170
Washington
595,848
Arizona
571,043
States with Lowest Net Migration
Connecticut
-63,899
Michigan
-73,053
New Jersey
-192,493
Illinois
-622,928
New York
-681,210
Source: U.S. Census Bureau
Exhibit 3: Projected Population Change in Texas Counties, 2020 to 2050
County
Projected 2020 population
Projected 2050 population
Difference
Percentage Difference
Anderson County
58198
52597
-5601
-9.6%
Andrews County
22268
100627
78359
351.9%
Angelina County
90437
90638
201
0.2%
Aransas County
27699
46198
18499
66.8%
Archer County
8344
6349
-1995
-23.9%
Armstrong County
1948
1712
-236
-12.1%
Atascosa County
51831
73187
21356
41.2%
Austin County
30402
33352
2950
9.7%
Bailey County
7692
9045
1353
17.6%
Bandera County
21246
20087
-1159
-5.5%
Bastrop County
86103
124818
38715
45.0%
Baylor County
3624
3569
-55
-1.5%
Bee County
34445
39564
5119
14.9%
Bell County
353615
482318
128703
36.4%
Bexar County
2093427
3343929
1250502
59.7%
Blanco County
11504
12594
1090
9.5%
Borden County
685
663
-22
-3.2%
Bosque County
17765
14388
-3377
-19.0%
Bowie County
92568
84047
-8521
-9.2%
Brazoria County
375842
629936
254094
67.6%
Brazos County
229403
364929
135526
59.1%
Brewster County
9133
7799
-1334
-14.6%
Briscoe County
1568
1374
-194
-12.4%
Brooks County
7175
6102
-1073
-15.0%
Brown County
38923
35237
-3686
-9.5%
Burleson County
17718
18255
537
3.0%
Burnet County
48196
61402
13206
27.4%
Caldwell County
44284
62024
17740
40.1%
Calhoun County
22840
23912
1072
4.7%
Callahan County
13456
13595
139
1.0%
Cameron County
427879
413004
-14875
-3.5%
Camp County
13322
14814
1492
11.2%
Carson County
5799
5271
-528
-9.1%
Cass County
30326
25450
-4876
-16.1%
Castro County
7103
4605
-2498
-35.2%
Chambers County
42302
77273
34971
82.7%
Cherokee County
52178
50305
-1873
-3.6%
Childress County
7062
6727
-335
-4.7%
Clay County
9787
6309
-3478
-35.5%
Cochran County
3348
3832
484
14.5%
Coke County
3215
2953
-262
-8.1%
Coleman County
8478
7925
-553
-6.5%
Collin County
1039202
2444316
1405114
135.2%
Collingsworth County
3210
3544
334
10.4%
Colorado County
21273
20572
-701
-3.3%
Comal County
147536
389328
241792
163.9%
Comanche County
13075
8960
-4115
-31.5%
Concho County
4147
3856
-291
-7.0%
Cooke County
39727
39797
70
0.2%
Coryell County
78315
86254
7939
10.1%
Cottle County
1510
1539
29
1.9%
Crane County
6209
18418
12209
196.6%
Crockett County
4040
4219
179
4.4%
Crosby County
6464
6604
140
2.2%
Culberson County
2245
1590
-655
-29.2%
Dallam County
7237
9279
2042
28.2%
Dallas County
2733926
3858686
1124760
41.1%
Dawson County
13592
13269
-323
-2.4%
De Witt County
21737
24879
3142
14.5%
Deaf Smith County
18143
15862
-2281
-12.6%
Delta County
5367
5006
-361
-6.7%
Denton County
897869
2323056
1425187
158.7%
Dickens County
2174
1677
-497
-22.9%
Dimmit County
11743
19067
7324
62.4%
Donley County
3410
2589
-821
-24.1%
Duval County
11796
9970
-1826
-15.5%
Eastland County
18205
15304
-2901
-15.9%
Ector County
184838
494413
309575
167.5%
Edwards County
1991
1640
-351
-17.6%
El Paso County
876105
1043982
167877
19.2%
Ellis County
177721
267977
90256
50.8%
Erath County
41526
51307
9781
23.6%
Falls County
16603
13820
-2783
-16.8%
Fannin County
34597
32934
-1663
-4.8%
Fayette County
26086
30148
4062
15.6%
Fisher County
3985
3693
-292
-7.3%
Floyd County
5786
4220
-1566
-27.1%
Foard County
1240
1181
-59
-4.8%
Fort Bend County
840214
2254963
1414749
168.4%
Franklin County
10924
11553
629
5.8%
Freestone County
19860
17774
-2086
-10.5%
Frio County
20024
28832
8808
44.0%
Gaines County
22121
45004
22883
103.4%
Galveston County
355178
578719
223541
62.9%
Garza County
6784
7924
1140
16.8%
Gillespie County
26191
28729
2538
9.7%
Glasscock County
1365
1485
120
8.8%
Goliad County
7717
8880
1163
15.1%
Gonzales County
21347
24352
3005
14.1%
Gray County
24252
34435
10183
42.0%
Grayson County
131758
151025
19267
14.6%
Gregg County
125729
123702
-2027
-1.6%
Grimes County
28928
32369
3441
11.9%
Guadalupe County
170264
351154
180890
106.2%
Hale County
33202
22050
-11152
-33.6%
Hall County
3305
2918
-387
-11.7%
Hamilton County
8220
8167
-53
-0.6%
Hansford County
5820
6471
651
11.2%
Hardeman County
3870
3505
-365
-9.4%
Hardin County
56485
54538
-1947
-3.4%
Harris County
4978446
7900994
2922548
58.7%
Harrison County
68246
69379
1133
1.7%
Hartley County
6067
6090
23
0.4%
Haskell County
6197
7812
1615
26.1%
Hays County
234895
743171
508276
216.4%
Hemphill County
4644
11519
6875
148.0%
Henderson County
81177
78577
-2600
-3.2%
Hidalgo County
870357
1032453
162096
18.6%
Hill County
35673
31757
-3916
-11.0%
Hockley County
24636
28260
3624
14.7%
Hood County
58642
82222
23580
40.2%
Hopkins County
37040
36741
-299
-0.8%
Houston County
22620
18736
-3884
-17.2%
Howard County
41236
71192
29956
72.6%
Hudspeth County
3400
2392
-1008
-29.6%
Hunt County
96228
155128
58900
61.2%
Hutchinson County
21461
20042
-1419
-6.6%
Irion County
1508
1260
-248
-16.4%
Jack County
8841
8097
-744
-8.4%
Jackson County
15899
22862
6963
43.8%
Jasper County
35525
30941
-4584
-12.9%
Jeff Davis County
2113
1454
-659
-31.2%
Jefferson County
258670
255423
-3247
-1.3%
Jim Hogg County
5077
3935
-1142
-22.5%
Jim Wells County
42890
43088
198
0.5%
Johnson County
171701
237420
65719
38.3%
Jones County
19735
18192
-1543
-7.8%
Karnes County
15627
126431
110804
709.1%
Kaufman County
125133
218922
93789
75.0%
Kendall County
46306
138957
92651
200.1%
Kenedy County
476
546
70
14.7%
Kent County
795
784
-11
-1.4%
Kerr County
52267
56080
3813
7.3%
Kimble County
4344
3322
-1022
-23.5%
King County
309
359
50
16.2%
Kinney County
3462
3123
-339
-9.8%
Kleberg County
30987
28144
-2843
-9.2%
Knox County
3937
4443
506
12.9%
La Salle County
8309
12898
4589
55.2%
Lamar County
50014
44041
-5973
-11.9%
Lamb County
12776
8867
-3909
-30.6%
Lampasas County
21037
22531
1494
7.1%
Lavaca County
20735
30624
9889
47.7%
Lee County
17595
18280
685
3.9%
Leon County
17707
19107
1400
7.9%
Liberty County
85270
118081
32811
38.5%
Limestone County
23544
21199
-2345
-10.0%
Lipscomb County
3651
4082
431
11.8%
Live Oak County
12030
13088
1058
8.8%
Llano County
19452
20657
1205
6.2%
Loving County
92
77
-15
-16.3%
Lubbock County
317209
474272
157063
49.5%
Lynn County
5588
4206
-1382
-24.7%
Madison County
14527
19122
4595
31.6%
Marion County
10294
8155
-2139
-20.8%
Martin County
6044
11695
5651
93.5%
Mason County
3899
3333
-566
-14.5%
Matagorda County
37063
33253
-3810
-10.3%
Maverick County
59937
67015
7078
11.8%
McCulloch County
8660
8523
-137
-1.6%
McLennan County
253060
289089
36029
14.2%
McMullen County
783
736
-47
-6.0%
Medina County
50604
61824
11220
22.2%
Menard County
2188
1852
-336
-15.4%
Midland County
187362
573085
385723
205.9%
Milam County
24635
22190
-2445
-9.9%
Mills County
4870
4285
-585
-12.0%
Mitchell County
9865
10440
575
5.8%
Montague County
19199
15318
-3881
-20.2%
Montgomery County
613932
1483476
869544
141.6%
Moore County
21573
23336
1763
8.2%
Morris County
12448
9884
-2564
-20.6%
Motley County
1172
1015
-157
-13.4%
Nacogdoches County
64105
57618
-6487
-10.1%
Navarro County
47984
41970
-6014
-12.5%
Newton County
13724
10725
-2999
-21.9%
Nolan County
15642
15936
294
1.9%
Nueces County
383707
510636
126929
33.1%
Ochiltree County
11309
15154
3845
34.0%
Oldham County
2200
2127
-73
-3.3%
Orange County
86155
87825
1670
1.9%
Palo Pinto County
27859
23676
-4183
-15.0%
Panola County
24576
23990
-586
-2.4%
Parker County
135621
194803
59182
43.6%
Parmer County
9200
5757
-3443
-37.4%
Pecos County
16548
18116
1568
9.5%
Polk County
49091
53749
4658
9.5%
Potter County
122708
114659
-8049
-6.6%
Presidio County
5906
2654
-3252
-55.1%
Rains County
11378
10842
-536
-4.7%
Randall County
138102
250003
111901
81.0%
Reagan County
4226
8145
3919
92.7%
Real County
3407
3190
-217
-6.4%
Red River County
12610
10459
-2151
-17.1%
Reeves County
15707
22000
6293
40.1%
Refugio County
7573
7559
-14
-0.2%
Roberts County
983
1056
73
7.4%
Robertson County
16888
16915
27
0.2%
Rockwall County
102241
211545
109304
106.9%
Runnels County
11009
12001
992
9.0%
Rusk County
52765
47883
-4882
-9.3%
Sabine County
9936
6816
-3120
-31.4%
San Augustine County
8405
6538
-1867
-22.2%
San Jacinto County
28844
35577
6733
23.3%
San Patricio County
71325
86280
14955
21.0%
San Saba County
5873
4931
-942
-16.0%
Schleicher County
3312
3855
543
16.4%
Scurry County
18381
23405
5024
27.3%
Shackelford County
3405
3251
-154
-4.5%
Shelby County
25545
22031
-3514
-13.8%
Sherman County
3276
3538
262
8.0%
Smith County
235138
289204
54066
23.0%
Somervell County
9294
10315
1021
11.0%
Starr County
64731
62849
-1882
-2.9%
State of Texas
29677772
47342417
17664645
59.5%
Stephens County
9570
9051
-519
-5.4%
Sterling County
1252
1326
74
5.9%
Stonewall County
1523
1571
48
3.2%
Sutton County
4381
4225
-156
-3.6%
Swisher County
7414
5555
-1859
-25.1%
Tarrant County
2143603
3184835
1041232
48.6%
Taylor County
139453
154007
14554
10.4%
Terrell County
1054
1017
-37
-3.5%
Terry County
13040
15209
2169
16.6%
Throckmorton County
1519
1174
-345
-22.7%
Titus County
32952
30238
-2714
-8.2%
Tom Green County
123273
170294
47021
38.1%
Travis County
1291415
1974018
682603
52.9%
Trinity County
14233
11637
-2596
-18.2%
Tyler County
21343
19378
-1965
-9.2%
Upshur County
41654
48468
6814
16.4%
Upton County
3983
6557
2574
64.6%
Uvalde County
27937
32332
4395
15.7%
Val Verde County
48253
41553
-6700
-13.9%
Van Zandt County
55469
59003
3534
6.4%
Victoria County
97892
126847
28955
29.6%
Walker County
74068
104305
30237
40.8%
Waller County
50739
79199
28460
56.1%
Ward County
13592
33336
19744
145.3%
Washington County
35155
35932
777
2.2%
Webb County
276183
308573
32390
11.7%
Wharton County
41941
40449
-1492
-3.6%
Wheeler County
5783
6421
638
11.0%
Wichita County
133138
121337
-11801
-8.9%
Wilbarger County
13038
10057
-2981
-22.9%
Willacy County
22134
19226
-2908
-13.1%
Williamson County
589861
1638796
1048935
177.8%
Wilson County
51800
80564
28764
55.5%
Winkler County
9295
23352
14057
151.2%
Wise County
65806
76958
11152
16.9%
Wood County
45292
51939
6647
14.7%
Yoakum County
9225
15398
6173
66.9%
Young County
18712
17516
-1196
-6.4%
Zapata County
14409
12816
-1593
-11.1%
Zavala County
12682
14261
1579
12.5%
Source: Texas Demographic Center
Older, but Younger
Texas’ population is growing across all population groups. Between 2010 and 2018, Texas added about 3.5 million residents, more than any other state. That’s a 13.9 percent increase, more than twice the nation’s 5.8 percent growth. Texas was one of the fastest-growing states in this period — a remarkable feat considering the state’s already large population.
Texas is aging as the huge baby-boom generation enters its retirement years, as is the nation and the entire developed world. In the 2010-2018 period, the number of Texans aged 65 and older rose by 1 million, a 38.5 percent increase; in the U.S., growth for this age group was 30.2 percent.
Where Texas stands out, however, is its under-18 population growth.
Since 2010, Texas saw the highest rate of under-18 population growth among the six most populous states and the second-highest in the nation, behind North Dakota. In four of the six most populous states, the under-18 population actually fell in this period — as it did in the U.S. as a whole (Exhibit 4).
Exhibit 4: Change in the Under-18 Population of the U.S. and the Six Largest States, 2010-2018
State
2010 under-18 population
2018 under-18 population
Total Change
Percent Change
Texas
6,877,757
7,398,099
520,342
7.6%
Florida
3,997,523
4,229,081
231,558
5.8
California
9,280,524
8,989,955
-290,569
-3.1
Pennsylvania
2,786,430
2,648,911
-137,519
-4.9
New York
4,319,807
4,068,102
-251,705
-5.8
Illinois
3,123,255
2,857,266
-265,989
-8.5
United States
74,120,770
73,399,342
-721,428
-1.0
Source: U.S. Census Bureau
In numerical terms, Texas’ increase of 520,342 children between 2010 and 2018 topped that of all other states and far exceeded second-place Florida’s increase of 231,588. The nation’s total under-18 population fell by more than 700,000.
Looking Toward 2050
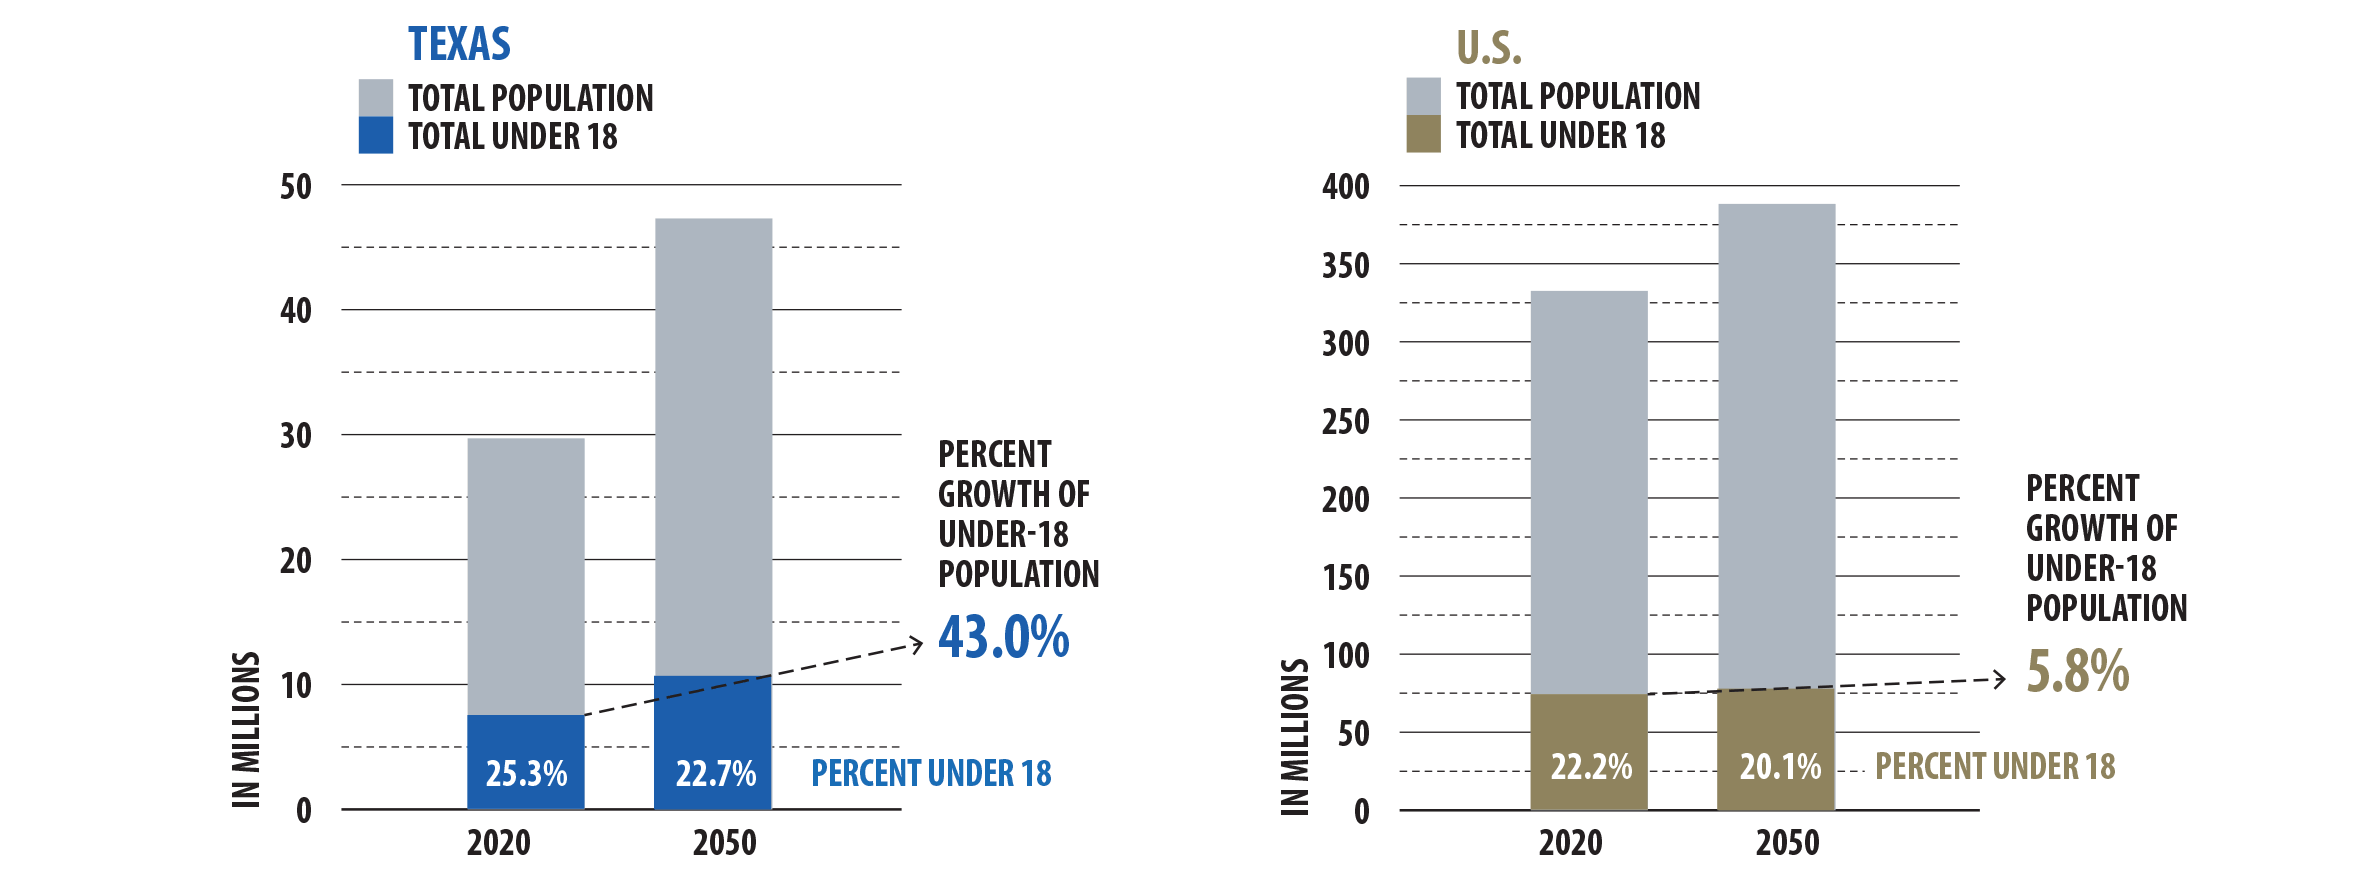
TDC projections through 2050 show these under-18 population growth trends continuing steadily. In the state as a whole, TDC predicts a 43 percent rise in the under-18 population by 2050, or 3.2 million more children. That’s more than seven times the 5.8 percent growth rate expected for the nation’s child population (Exhibit 5). By 2050, 22.7 percent of Texas’ population will be under 18.
Unsurprisingly, TDC expects urban counties to top the list in numerical growth, with Harris County alone adding more than half a million children by 2050. Most of the 10 Texas counties with the highest projected under-18 growth will more than double their child populations (Exhibit 6).
Exhibit 7 lists the 10 counties TDC expects to have the fastest rate of under-18 growth. Andrews County, near Midland and Odessa, could see its under-18 population more than quadruple. In Kendall County, north of San Antonio, and Hays County, part of the Austin-Round Rock metropolitan area, the number of children could triple.
Exhibit 5: Projected Texas and U.S. Population Percentage Growth, 2020-2050
Projected Texas Population Growth 2020-2050
2020
2050
Total population (millions)
29.7
47.3
Total under age 18 (millions)
7.5
10.7
Share under age 18
25.3%
22.7%
Percent growth in under-18 population
43.0%
Projected U.S. Population Growth 2020-2050
2020
2050
Total population (millions)
332.6
388.9
Total under age 18 (millions)
73.6
78.2
Share under age 18
22.2%
20.1%
Percent growth in under-18 population
5.8%
Sources: U.S. Census Bureau and Texas Demographic Center
Exhibit 6: Top Texas Counties for Projected Under-18 Population Growth, 2020-2050
County
Rank
2020
2050
Total Change
Percent Change
Harris
1
1,330,726
1,882,981
552,255
41.5%
Collin
2
258,321
555,220
296,899
114.9
Fort Bend
3
210,803
507,177
296,374
140.6
Denton
4
210,980
494,396
283,416
134.3
Williamson
5
147,318/td>
379,221/td>
231,903/td>
157.4
Bexar
6
533,642
762,073
228,431
42.8
Dallas
7
728,017
935,446
207,429
28.5
Montgomery
8
152,679
346,465
193,786
126.9
Tarrant
9
541,243
701,618
160,375
29.6
Hays /th>
10
52,771
156,781
104,010
197.1
Sources: U.S. Census Bureau and Texas Demographic Center
Exhibit 7: Texas Counties with the Fastest Projected Under-18 Population Growth, 2020-2050
Rank
County
2020
2050
Total Increase
Percent Change
Andrews County
1
6,851
30,147
23,296
340.0%
Kendall County
2
10,300
31,684
21,384
207.6
Hays County
3
52,771
156,781
104,010
197.1
Hemphill County
4
1,478
4,070
2,592
175.4
Midland County
5
52,452
142,856
90,404
172.4
Comal County
6
32,639
87,854
55,215
169.2
Williamson County
7
147,318
379,221
231,903
157.4
Crane County
8
1,775
4,459
2,684
151.2
Fort Bend County
9
210,803
507,177
296,374
140.6
Denton County
10
210,980
494,396
283,416
134.3
Source: Texas Demographic Center
Race and Ethnicity
In the last decade, Texas and Florida both saw huge increases in their Hispanic child populations, and the Asian population rose substantially in Texas and California as well. But Texas is the only one of the six largest states to show an increase among all racial and ethnic groups within its under-18 population (Exhibit 8).
Exhibit 8: Change in Under-18 Population by Race/Ethnicity, Six Largest States, 2008-2018
State
Asian
Black
Hispanic
White
California
101,924
-53,295
-29,934
-213,515
Texas
108,831
89,071
351,906
43,154
Florida
27,878
48,141
247,163
-43,411
New York
42,226
-66,891
58,362
-240,416
Pennsylvania
23,015
-8,421
72,820
-206,846
Illinois
20,611
-76,857
-6,669
-184,977
Source: U.S. Census Bureau
Texas is an ethnically diverse state, and current growth trends will make it more so. Through 2050, Texas will see its largest under-18 population increases among Hispanics (about 2 million children) and Asians (almost 1 million). The number of “Non-Hispanic Other” children — which, according to TDC, refers mainly to those who identify as two or more races — is expected to triple. Meanwhile, the population of white children in Texas is projected to show almost no growth through 2050 (Exhibit 9).
In the next 30 years, TDC expects Texas’ under-18 population to remain nearly 50 percent Hispanic, a considerably higher proportion than in the U.S. as a whole. Substantial increases in Asian and “Non-Hispanic Other” children will offset a proportional decline of almost 10 percent among white children by 2050.
The U.S. Census Bureau projects the nationwide share of Hispanic children to rise from 24.9 percent to 32.0 percent in 2060, while that of white children will fall from 51.1 percent to 36.5 percent.
Exhibit 9: Projected Texas Under-18 Population by Race/Ethnicity, 2020-2050
Year
White
Black
Hispanic
Asian
Non-Hispanic Other
2020
2,317,592
890,159
3,712,081
344,811
250,496
2021
2,322,156
902,468
3,754,305
357,525
258,486
2022
2,326,803
914,704
3,797,022
370,438
266,554
2023
2,332,313
927,124
3,839,288
384,468
274,571
2024
2,338,055
939,258
3,883,787
399,547
282,712
2025
2,342,894
951,012
3,927,101
415,753
290,953
2026
2,347,858
963,160
3,972,214
432,092
298,967
2027
2,354,642
976,761
4,024,036
451,032
307,369
2028
2,362,341
991,907
4,078,540
471,073
316,045
2029
2,368,275
1,007,417
4,143,353
490,732
326,447
2030
2,373,007
1,022,213
4,207,761
511,625
337,046
2031
2,376,694
1,036,425
4,271,697
533,741
347,877
2032
2,379,342
1,050,025
4,334,706
557,049
358,913
2033
2,381,039
1,063,208
4,396,970
581,746
370,097
2034
2,382,013
1,075,994
4,458,138
607,728
381,466
2035
2,382,256
1,088,529
4,518,182
634,998
392,985
2036
2,382,009
1,100,876
4,577,065
663,477
404,760
2037
2,381,421
1,113,126
4,634,564
693,283
416,728
2038
2,380,474
1,125,258
4,690,744
724,232
428,930
2039
2,379,471
1,137,416
4,745,553
756,298
441,392
2040
2,378,554
1,149,606
4,799,014
789,461
454,029
2041
2,377,763
1,161,957
4,851,211
823,670
466,936
2042
2,377,274
1,174,450
4,902,165
858,880
480,110
2043
2,377,236
1,187,218
4,952,205
895,048
493,480
2044
2,377,641
1,200,237
5,001,420
932,200
507,180
2045
2,378,622
1,213,489
5,049,974
970,288
521,109
2046
2,380,196
1,227,102
5,098,392
1,009,326
535,369
2047
2,382,421
1,241,094
5,147,102
1,049,348
549,904
2048
2,385,287
1,255,525
5,196,248
1,090,412
564,853
2049
2,388,703
1,270,398
5,246,376
1,132,617
580,186
2050
2,392,698
1,285,703
5,297,102
1,176,022
595,933
Source: Texas Demographic Center
Today’s Youth, Tomorrow’s Workforce
Today’s rapid growth in Texas’ number of young people will boost our working-aged population in the future. The number of Texans aged 25 to 54 — generally considered the prime working years — is increasing at a far greater pace than in the U.S. as a whole. From 2010 to 2033, this population is expected to rise by 35 percent in Texas, compared to 9.6 percent in the U.S. Texas’ share of the entire U.S. population for this age group is expected to rise from 8.3 percent to 10.2 percent in 2033. In other words, Texas’ share of all Americans of working age will increase significantly (Exhibit 10).
Exhibit 10: Percent Change in Prime Working-Aged Population (25-54), Texas vs U.S., 2010-2033
Year
USA
Texas
2010
0.0
0.0%
2011
0.0%
.1%
2012
-0.1%
2.2%
2013
-0.1%
3.3%
2014
0.0%
4.8%
2015
0.3%
6.6%
2016
0.6%
8.2%
2017
0.9%
9.5%
2018
1.1%
10.8%
2019
1.4%
12.0%
2020
1.7%
13.3%
2021
2.1%
14.8%
2022
2.6%
16.3%
2023
3.2%
17.9%
2024 3.7%
19.4%
2025
4.1%
20.9%
2026
4.6%
22.4%
2027
5.1%
24.0%
2028
5.8%
25.9%
2029
6.6%
27.8%
2030
7.3%
29.6%
2031
8.2%
31.5%
2032
8.9%
33.4%
2033
9.6%
35.3%
Source: JobsEQ and U.S. Census Bureau
The wave of baby-boom retirements is likely to slow economic growth in the U.S. and throughout much of the world. By definition, retirees produce less in economic terms, and they tend to spend less as well.
That said, given the rapid expansion in Texas’ young population and the state’s continuing role as an immigration magnet, our workforce is likely to help offset this transition — assuming it has the education and skills it needs to succeed in a challenging environment.
In next month’s issue of Fiscal Notes, look for the second and final part of this series on young Texans. FN
For detailed information on the demographic makeup of the Texas population, visit the Texas Demographic Center.