Cardboard box production or sack lunches aren’t typical measures of state and national economies. It’s much more common to consult statistical reports from federal agencies like the Bureau of Labor Statistics, Bureau of Economic Analysis and Census Bureau for precise, dependable data that inform wide-ranging policy and spending decisions. But these reports usually are released once a month at most, while those studying the economy may need more frequent updates to keep their fingers on the pulse of the economy.
That’s where unconventional economic indicators come in. During the height of the pandemic, for example, the Comptroller’s office examined factors including airline travel and restaurant reservations to continuously monitor real-time trends.
The following indicators, as unofficial and unusual as they are, could preview our economic position long before we see the bigger picture from official reports.
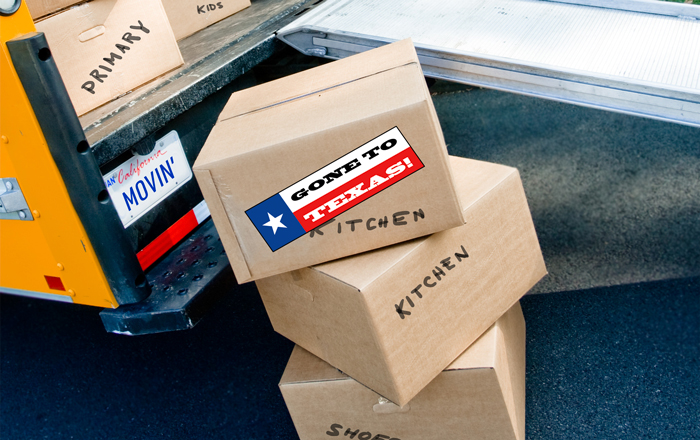
Wasn’t born in Texas, but got here as fast as I could
U-Haul tracks migration trends to and from every U.S. state and Canadian province, compiling data from more than 2.5 million of its one-way truck, trailer and portable moving container transactions annually. In 2024, the moving company ranked Texas as the state with the second-highest growth rate, as determined by the difference between the percentage of annual arrivals (50.3 percent) and annual departures (49.7 percent). Dallas-Fort Worth-Arlington was the top metro for growth in 2024, according to these data. Domestic migration helps fuel the state’s economy, as many people moving here trend younger and more educated than the overall population and therefore can boost Texas’ workforce.
Sack lunching
Although slow to recover from pre-pandemic levels, office occupancy is on the rise as more people return to traditional work schedules. But many of those workers are not returning to “lunching out” frequently during the work week. Circana, an analytics and technology company, found that lunchtime traffic at food establishments decreased from 2023 to 2024, while purchases of food at grocery stores increased. These data suggest more office workers are lunching on food from home as one way to save money.
This begs the question: Is a breakroom refrigerator stocked full of brown bag lunches a sign that the economy’s in a slump?
Thinking outside the box
Some economists believe cardboard box production is a strong indicator of the economy’s health: When cardboard box production is up, they say, so is the economy, because demand for boxes is often directly related to consumer spending. The Federal Reserve Bank of St. Louis tracks the consumer price index by industry, including “Corrugated and Solid Fiber Box Manufacturing.” These data show that box manufacturing dipped in late 2020 (reflecting diminished spending during the pandemic), peaked in late 2022 and dipped again in early 2024. According to the U.S. Bureau of Labor Statistics, year-over-year percent change in private industry wages and salaries peaked in summer 2022 and has been on the decline since then.
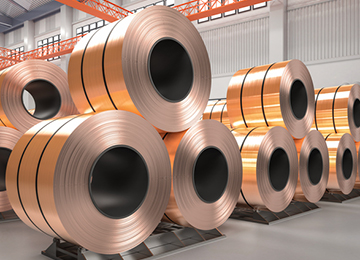
Cu soon
Copper manufacturing could be another indirect indicator of how well the economy is doing, because the metal is an essential component for everything from jewelry to the wiring in our home appliances to the electric transmission infrastructure that powers homes and businesses. In recent years, copper also has played an important role in the production of electric vehicles. CRU Group, a global market research and consulting firm, projects copper demand to skyrocket from 2020 to 2040, as the energy industry expands to keep up with population growth.
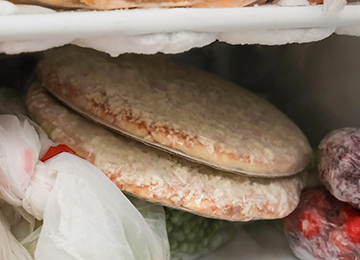
Rolling in the (frozen) dough
Restaurant dining, takeout and delivery may be cut from the family budget when money is tight — and that includes pizza. Placer.ai, a market intelligence and data analytics company, has found that when economic anxieties are high, consumers often go for less-expensive frozen pizza from the grocery store rather than eating out or having it delivered. Frozen pizza sales, which were approximately $7 billion in 2024, are projected to increase 6 percent annually, and some say it's because consumers are skittish about the economy in the near term.
Pet adoption
Owning and caring for pets is not cheap, and historically high inflation over the last few years didn’t help. Using data from the U.S. Department of Labor, the consulting firm Accenture found that just in the last year, pet services (such as grooming, boarding and pet sitting) have risen nearly 9 percent. During times of economic hardship, fewer people may adopt pets, and more may surrender pets they already have. According to PBS, nearly 20 percent of Americans adopted a cat or dog during the first 14 months of the COVID-19 pandemic, but in 2022, as the pandemic waned, 4 percent more pets entered shelters than left. That year, the Houston Humane Society reported a 50 percent increase in pet surrenders compared with pre-pandemic years.
Night lights
Satellite imagery of lighting from homes and businesses at night captures human activity and can indicate economic vigor. These data can register factors affecting the economy such as weather and policy shifts, show growth, and fill holes in the statistics available in rural or quickly changing areas. According to data compiled by Accenture, the cumulative monthly average nighttime brightness in Texas has gradually increased since 2020, but the state also has experienced spikes and dips during that time. For example, nighttime brightness cratered in July 2024, when Hurricane Beryl made landfall near Matagorda and traveled through northeast Texas, as well as in July 2022, when the state experienced an extreme heatwave.


 A REVIEW OF THE TEXAS ECONOMY