Skip navigation

Top navigation skipped
Comparison of Major Categories of Expenditure
Comparison of Major Categories of State Expenditures
Major Categories of Expense
Texas State Expenditures by County 2011
Major Spending Categories
The tables in this report list state expenditures in major categories that parallel those used in the 2012 Annual Cash Report.
Intergovernmental Payments include grants to colleges, schools and local governments; distribution of Foundation School Program funds to local school districts; textbooks for public schools; and allocations of mixed beverage taxes to cities and counties.
Labor Costs are salaries, wages, employee benefits payments, travel expenses and fees for professional consultant services. Also included is the state’s share of retirement contributions on behalf of state employees and public school teachers.
Public Assistance includes Temporary Assistance for Needy Families (TANF), Medicaid, grants in aid, child support payments and similar state services.
Highway Construction includes purchases of highway right-of-way and the expenses of constructing the state’s roads and bridges.
Operating Expenses are supplies, maintenance, utilities, rentals, leases, printing and non-capitalized equipment.
Capital Outlay expenditures include aircraft, computer equipment, land and buildings, major improvements to state property, motor vehicles and capitalized purchases of furniture and equipment.
Miscellaneous includes all other expenditures, such as court costs, fees, interest on debt, lottery payments and payment of claims and judgments.
Overview of Changes in Major Categories of Expenditure: 2002-2012
Texas state government expenditures by county rose from a net $62.1 billion in 2002 to $110.3 billion in 2012, a 77.6 percent increase. During this period, the seven major categories of expenditure grew at different rates.
Public assistance expenditures led all expenditure categories in both dollars and percentage of total net expenditures in both fiscal 2002 and 2012. These expenditures represented $21.9 billion of $62.1 billion in fiscal 2002 (35.2 percent), jumping by 104.4 percent to $44.7 billion out of a total $110.3 billion in fiscal 2012 (40.5 percent). Medical services and specialties ($18.6 billion) and unemployment payments ($5.1 billion) made up the bulk of these expenditures in fiscal 2012.
The second-largest category was intergovernmental payments, which comprised 26.8 percent (about $29.6 billion) of total expenditures in fiscal 2012. Labor costs were the third-largest category, at $23.1 billion, followed by miscellaneous expenses ($5.5 billion), highway construction ($4.2 billion), operating expenses ($2.8 billion) and capital outlays ($499 million).
The tables and chart below illustrate the growth in expenditures by major category between 2002 and 2012.
Comparison of Major Categories of Expenditure
Amount, Percent Change and Rank by Percent Change
Fiscal 2002 and 2012
| Major Category of Expenditure | Fiscal 2002 | Fiscal 2012 | Percent Change FY 2002 to 2012 |
Rank by Percent Change FY 2002 to 2012 |
|---|---|---|---|---|
| Intergovernmental Payments | $16,452,277,377 | $29,558,606,947 | 79.7 | 4 |
| Labor Costs | 15,262,023,314 | 23,104,954,376 | 51.4 | 5 |
| Public Assistance | 21,865,656,669 | 44,698,772,383 | 104.4 | 2 |
| Highway Construction | 3,512,991,134 | 4,186,344,597 | 19.2 | 6 |
| Operating Expenses | 1,520,692,069 | 2,811,577,022 | 84.9 | 3 |
| Capital Outlays | 476,366,298 | 499,363,461 | 4.8 | 7 |
| Miscellaneous | 2,442,903,562 | 5,459,803,333 | 123.5 | 1 |
| Total Net State Expenditures by County | $62,106,906,632 | $110,319,422,119 | 77.6 |
Comparison of Major Categories of State Expenditures
by County as Share of Total Net Expenditures
Fiscal 2002 and 2012
| Category of Expense | Fiscal 2002 | Percent of Net Expenditures Fiscal 2002 |
Fiscal 2012 | Percent of Net Expenditures Fiscal 2012 |
|---|---|---|---|---|
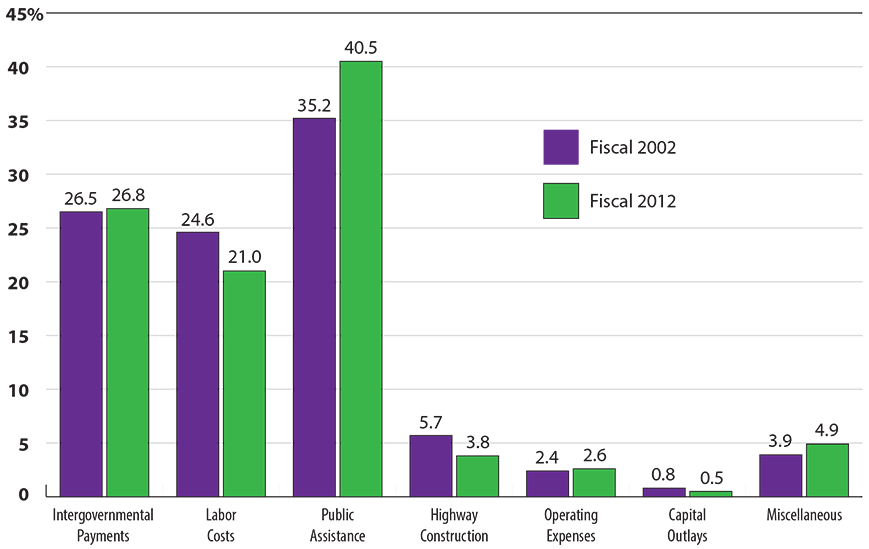
| Intergovernmental Payments | $16,452,277,377 | 26.5 | $29,558,606,947 | 26.8 |
| Labor Costs | 15,262,023,314 | 24.6 | 23,104,954,376 | 21.0 |
| Public Assistance | 21,865,656,669 | 35.2 | 44,698,772,383 | 40.5 |
| Highway Construction | 3,512,991,134 | 5.7 | 4,186,344,597 | 3.8 |
| Operating Expenses | 1,520,692,069 | 2.4 | 2,811,577,022 | 2.6 |
| Capital Outlays | 476,366,298 | 0.8 | 499,363,461 | 0.5 |
| Miscellaneous | 2,442,903,562 | 3.9 | 5,459,803,333 | 4.9 |
| Total Net Expenditures | $62,106,906,632 | $110,319,422,119 |
Major Categories of Expense
as Percent of Total Net Expenditures
Fiscal 2002 and 2012
Changes Affecting State Agencies
Legislation from the 82nd Texas Legislature affected a number of state agencies. The Texas Juvenile Probation Commission (Agency 665) and the Texas Youth Commission (Agency 694) were abolished, and their duties transferred to the new Texas Juvenile Justice Department (Agency 644). The Office of Violent Sex Offender Management (Agency 544) was funded separately under the Department of State Health Services Agency 537) for the 2012-2013 biennium. The Texas Department of Rural Affairs (Agency 357) became a department within the Texas Department of Agriculture (Agency 551). The Texas Real Estate Commission (Agency 329) became a self-directed, semi-independent agency.
Adjustments to the Uniform Statewide Accounting System
Most of the data in this report comes from the Uniform Statewide Accounting System. The Comptroller’s office uses USAS, a computerized accounting system, to control and report all Texas state government expenditures. In several instances, differences between the accounting system’s requirements and the need for an accurate report of state expenditures by county required the Comptroller’s office to adjust the distribution of state expenditures to counties.
The Comptroller’s office draws expenditure data from USAS in the form of vouchers submitted by state agencies for payment of goods and services. Vouchers, which cite the legal authority for the payment, result in state checks or warrants — either an electronic transfer or a check — to the vendor of the goods or services. Vendors may be businesses, government entities, individuals or organizations.
The distribution of most state expenditures among counties relies on a computerized file with the name and mailing address of each vendor. Designed to track accounting transactions, USAS does not identify the location of expenditures. A vendor’s address might not accurately indicate where the purchased goods or services were delivered.
The Comptroller’s office makes adjustments to the underlying USAS data for large expenditure categories that, if not reallocated, would misrepresent the distribution of state funds to counties. With USAS, certain major expenditures, such as state employee benefit payments or public assistance, may appear to be made only in Travis County, since it is the headquarters for most state agencies. In this report, these payments, including expenditures for insurance, retirement contributions and Social Security, are adjusted.
The Comptroller’s office reallocates unemployment compensation benefits to former state employees and insurance payments for current employees based on a percentage of state employees in each county. Employee retirement and Social Security payments are allocated by a ratio of state employee salaries by county and by agency, using USAS data. State contributions to the Teacher Retirement System are allocated to counties based on where payments to retirees from the trust fund were made.
Each year, the Comptroller’s office uses information from selected state agencies to adjust the data for this report. For fiscal 2012, the Attorney General’s office provided a list of its distribution of child support payments made to recipients in and out of state. The Department of Aging and Disability Services provided data by county for payments made for long-term care nursing facilities and hospice care; Title XX Long Term Care/Non-Medicaid Services; and Intermediate Care Facilities/Mental Retardation. The Department of Criminal Justice provided a list of vendors for each state-operated facility, with amounts paid to out-of-state vendors. The Comptroller’s office adjusted the Department of State Health Services’ payments for the Special Supplemental Food Program for Women, Infants and Children using a statewide distribution of the program’s client population. Data collected from the Health and Human Services Commission (HHSC), for Medicaid clients by county, were used to adjust fee-for-service and managed-care Medicaid expenditures. HHSC provided payment data by county for Temporary Assistance for Needy Families to make a proportional distribution by county.
The Comptroller’s office collected additional expenditure data from the Texas Education Agency (TEA) on school textbooks and allowable purchases from school districts’ allotments. TEA also supplied intergovernmental payments data on grants for elementary and secondary schools and school apportionment (the Foundation School Program). Senate Bill 6, passed by the 2011 Texas Legislature, established the Instructional Materials Fund (IMF) using funds from the distribution of the permanent school fund. A school district is entitled to receive an annual Instructional Materials Allotment (IMA) from the IMF for each student enrolled. The IMA may be used to purchase adopted and non-adopted instructional materials, technological equipment and technology-related services. For adopted instructional materials, TEA pays the publisher on the district’s behalf, using its IMA (7383 report). For non-adopted instructional materials, technology services and technological equipment, the district must request a disbursement of funds to acquire the products or services. Upon TEA approval, the funds are sent directly to the district (7601 report).
The Texas Department of Transportation provided information on highway construction, maintenance and right-of-way purchases to more accurately allocate expenditures to the county in which the construction was performed. The Veterans Land Board at the Texas General Land Office provided expenditure data on counties receiving housing assistance and home improvement program funds.
The Texas Workforce Commission supplied fiscal 2012 unemployment insurance benefit data by county reflecting more than $2.5 billion in federal and nearly $2.4 billion in state benefits, for a total of almost $4.9 billion in unemployment insurance benefit payments paid in fiscal 2012.
Each year, the Texas Workforce Commission includes federal unemployment benefits in its data submission for this report. Before July 2008, federal benefits were typically modest and included natural disaster benefits, benefits due to employees laid off due a trade agreement and benefits for federal or military employees. In July 2008, when the economy began to contract, Congress passed Public Law 110-252 (the Supplemental Appropriations Act, 2008), which established the Emergency Unemployment Compensation Program (EUC08). Since then, Congress has passed 11 additional statutes that extended and in some cases expanded the program. Most recently, HR 8, the American Taxpayer Relief Act, was signed into law on January 2, 2013. This law extends federally funded EUC08 unemployment benefits to January 3, 2014. During portions of fiscal 2012, Texans were able to collect up to 99 weeks of unemployment benefits. Under the most recent statute, however, the maximum length of state and federally funded benefits is 60 weeks.
Expenditures not allocated to counties are moved to “Expenditures Unallocable to Texas Counties.” Transactions moved to this category in fiscal 2012 include expenditures for Object Codes 7001-7048, Salaries and Wages; Object Code 7206, Service Fee Paid to the Lottery Operator (GTech, a subsidiary of Lottomatica in Rome, Italy); Object Code 7209, Lottery Winnings-Installment; Object Code 7245, Financial and Accounting Services; Object Code 7253, Other Professional Services; Object Code 7299, Purchased Contracted Services; Object Code 7312, Medical Supplies; Object Code 7829, Disburse Medicaid Incentive Transfer – State (UPL); Object Code 7662, Vendor Drug Program; Object Code 7664, Supplementary Medical Insurance Benefits and Object 7801, Interest on Governmental and Fiduciary Long-Term Debt. Unallocable state hospital expenditures are listed under Object Code 7830, Disbursement of Disproportionate Share Funds to State Hospitals; and Object Code 7832, State Hospital Payments of State Matching Disproportionate Share Funds and Upper Payment Limit Funds to the Texas Department of Health.
In some cases, smaller objects of expenditure that have not been redistributed may be reflected in the county where payment was made, not in the county where the goods or services were delivered.
The objects of expenditure comprising each of the major spending categories are:
| INTERGOVERNMENTAL PAYMENTS | ||
|---|---|---|
| 7383 | Textbooks for Public Free Schools | $366,336,624 |
| 7601 | Grants–Elementary and Secondary Schools | 5,963,134,225 |
| 7602 | School Apportionment–Foundation Program | 19,222,015,479 |
| 7603 | Grants–Junior Colleges | 1,022,776,947 |
| 7604 | Grants–Senior Colleges and Universities | 124,890,692 |
| 7611 | Payments/Grants–Cities | 761,603,460 |
| 7612 | Payments/Grants–Counties | 892,718,504 |
| 7613 | Payments/Grants–Other Political Subdivisions | 619,708,739 |
| 7621 | Grants–Council of Governments | 196,682,571 |
| 7622 | Grants–Judicial Districts | 239,730,008 |
| 7683 | Allocations to Cities–Mixed Beverage Tax | 55,072,015 |
| 7684 | Allocation to Counties–Mixed Beverage Tax | 59,735,138 |
| 7688 | Allocation for International Fuels Tax Agreement (IFTA ) | 34,202,545 |
| TOTAL INTERGOVERNMENTAL PAYMENTS | $29,558,606,947 | |
| LABOR COSTS | ||
|---|---|---|
| 2012 Expenditures | ||
| Salaries and Wages | ||
| 7001 | Salaries and Wages–Line Item Exempt Positions | $107,370,214 |
| 7002 | Salaries and Wages–Classified and Non-Classified Permanent Full-Time Employees | 5,497,471,653 |
| 7003 | Salaries and Wages–Classified and Non-Classified Permanent Part-Time Employees | 48,133,634 |
| 7004 | Salaries and Wages–Classified and Non-Classified Non-Permanent Full-Time Employees | 16,577,611 |
| 7005 | Salaries and Wages–Classified and Non-Classified Non-Permanent Part-Time Employees | 5,569,656 |
| 7006 | Salaries and Wages–Hourly Full-Time Employees | 32,136,854 |
| 7007 | Salaries and Wages–Hourly Part-Time Employees | 6,439,541 |
| 7008 | Higher Education Salaries–Faculty/Academic Employees | 1,802,123,410 |
| 7009 | Higher Education Salaries–Faculty/Academic Equivalent Employees | 52,444,043 |
| 7010 | Higher Education Salaries–Professional/Administrative Employees | 771,319,332 |
| 7011 | Higher Education Salaries–Extension–Professional/Administrative Employees | 14,085,137 |
| 7014 | Higher Education Salaries–Student Employees | 186,144,650 |
| 7015 | Higher Education Salaries–Classified Employees | 954,115,807 |
| 7016 | Salaries and Wages–Classified Employees Receiving Twice-a-Month Salary Payment | 292,116,960 |
| 7017 | One-Time Merit Increase | 36,133,621 |
| 7018 | Hardship Stations Pay | 384,325 |
| 7019 | Compensatory Time Pay | 10,058,530 |
| 7020 | Hazardous Duty Pay | 51,495,900 |
| 7021 | Overtime Pay | 154,732,407 |
| 7022 | Longevity Pay | 159,442,291 |
| 7023 | Lump Sum Termination Payment | $81,204,342 |
| 7024 | Termination Pay–Death Benefits | 1,584,306 |
| 7025 | Compensatory or Salary Per Diem | 208,872 |
| 7028 | Productivity Bonus Awards | 335,524 |
| 7031 | Emoluments and Allowances | 38,656,825 |
| 7035 | Stipend Pay | 6,381,725 |
| 7037 | Incentive Award for Authorized Service to Veterans | 104,134 |
| 7046 | High Performance Bonus for Administration of the Supplemental Nutrition Assistance Program (SNAP) | 8,638,400 |
| 7047 | Recruitment and Retention Bonuses | 1,421,863 |
| 7050 | Benefit Replacement Pay | 33,227,322 |
| TOTAL SALARIES AND WAGES | 10,370,058,888 | |
| Employee Benefits | ||
| 7032 | Employees Retirement–State Contribution | 356,369,707 |
| 7033 | Employee Retirement–Other Employment Expenses | 1,420,490 |
| 7041 | Employee Insurance Payments–Employer Contribution | 1,910,863,086 |
| 7042 | Payroll Health Insurance Contribution | 54,510,343 |
| 7043 | F.I.C.A. Employer Matching Contribution | 726,643,588 |
| 7052 | Unemployment Compensation Benefits–Special Fund Reimbursement | 47,641,086 |
| 7061 | Workers' Compensation Claims–Self Insurance Programs | 2,722,916 |
| 7062 | Workers' Compensation–Indemnity Payments | 15,442,930 |
| 7082 | Retirement/Benefits Payments–Judicial Retirement System | 26,464,422 |
| 7086 | Optional Retirement–State Match | 141,886,232 |
| 7231 | Workers' Compensation–Medical Services and Attorney Payments | 24,143,597 |
| 7232 | Workers' Compensation Self Insurance Programs–Medical Services and Attorney Payments | 1,943,323 |
| 7233 | Employee Benefit Payments | 5,476,763,080 |
| 7917 | Allocations from Fund 0001 to TRS Trust Account 0960, Retired School Employee GIP Trust 0989, and GR Account–Excess Benefit Arrangement, TRS 5031 (Dedicated Receipts) | 1,688,831,687 |
| TOTAL EMPLOYEE BENEFITS | 10,475,636,487 | |
| Travel | ||
| 7101 | Travel In-State–Public Transportation Fares | 17,174,131 |
| 7102 | Travel In-State–Mileage | 58,060,302 |
| 7103 | Travel–Per Diem, Non-Overnight Travel–Legislature | 168,616 |
| 7104 | Travel In-State–Actual Meal and Lodging Expenses–Overnight Travel | 317,589 |
| 7105 | Travel In-State–Incidental Expenses | 8,065,840 |
| 7106 | Travel In-State–Meals and Lodging | 45,920,010 |
| 7107 | Travel In-State–Non-Overnight Travel (Meals) | 430,281 |
| 7108 | Travel In-State–Actual Expense Meals–No Overnight Travel | 38,289 |
| 7110 | Travel In-State–Board or Commission Member Meal and Lodging Expenses | 659,740 |
| 7111 | Travel Out-of-State–Public Transportation Fares | 6,256,218 |
| 7112 | Travel Out-of-State–Mileage | 386,764 |
| 7113 | Travel–Per Diem, Overnight Travel–Legislature | 623,028 |
| 7114 | Travel Out-of-State–Actual Meal and Lodging Expenses, Overnight Travel | 1,177,004 |
| 7115 | Travel Out-of-State–Incidental Expenses | 1,194,952 |
| 7116 | Travel Out-of-State–Meals and Lodging Not to Exceed the Locality-Based Allowance | 4,301,786 |
| 7117 | Travel Out-of-State–Non-Overnight Travel (Meals) | 696 |
| 7118 | Travel Out-of-State–Actual Expense Meals–No Overnight Travel | 477 |
| 7121 | Travel–Foreign | $564,938 |
| 7122 | Travel In-State–Single-Engine Aircraft Mileage | 23,415 |
| 7123 | Travel Out-of-State–Single-Engine Aircraft Mileage | 979 |
| 7124 | Travel In-State–Twin-Engine Aircraft Mileage | 9,596 |
| 7126 | Travel In-State–Turbine-Powered or Other Aircraft Mileage | 22,084 |
| 7128 | Travel–Apartment/House Rental Expense | 17,239 |
| 7130 | Travel Out-of-State–Board or Commission Member Meal and Lodging Expenses | 64,380 |
| 7131 | Travel–Prospective State Employees | 312,311 |
| 7134 | Legislative Per Diem | 6,023 |
| 7135 | Travel In-State–State Hotel Occupancy Tax Expense Outside Galveston, Port Aransas and South Padre Island City Limits | (423,551) |
| 7136 | Travel In-State–State Hotel Occupancy Tax Expense Inside Galveston City Limits | (3,770) |
| 7137 | Travel In-State-State Hotel Tax Expense Inside South Padre Island City Limits | (682) |
| 7138 | Travel In-State-State Hotel Tax Expense Inside Port Aransas City Limits | (30) |
| TOTAL TRAVEL | 145,368,656 | |
| Professional Fees and Services | ||
| 7238 | Foreign Office Activities | 351,520 |
| 7239 | Consultant Services–Approval by Office of the Governor | 7,336,424 |
| 7240 | Consultant Services–Other | 21,538,272 |
| 7242 | Consulting Services–Information Technology (Computer) | 13,821,162 |
| 7243 | Educational/Training Services | 14,989,908 |
| 7245 | Financial and Accounting Services | 32,956,470 |
| 7246 | Legal Services | 18,138,840 |
| 7247 | Hearings Officers–Pre-approved by the State Office of Administrative Hearings | 22,817 |
| 7248 | Medical Services | 507,025,512 |
| 7249 | Veterinary Services | 590,583 |
| 7252 | Lecturers–Higher Education | 1,108,560 |
| 7253 | Other Professional Services | 980,725,615 |
| 7254 | Other Witness Fees | 4,282,749 |
| 7255 | Investment Counseling Services | 19,625,465 |
| 7256 | Architectural/Engineering Services | 269,901,088 |
| 7257 | Legal Services–Approval by the State Office of Administrative Hearings | 221,495 |
| 7258 | Legal Services–Other | 13,186,840 |
| 7259 | Race Track Officials | 3,500 |
| 7275 | Information Technology Services | 207,950,598 |
| 7396 | TxDOT Toll Road Expenditures-Preliminary Engineering | 112,927 |
| TOTAL PROFESSIONAL FEES AND SERVICES | 2,113,890,345 | |
| TOTAL LABOR COSTS | $23,104,954,376 | |
| PUBLIC ASSISTANCE PAYMENTS | ||
|---|---|---|
| 2012 Expenditures | ||
| 7214 | Public Assistance Payments–Unemployment | $5,124,527,964 |
| 7215 | Return of Retirement Contributions | 473,204,294 |
| 7623 | Grants–Community Service Programs | 2,346,919,004 |
| 7624 | Grants–Individuals | 31,760,290 |
| 7640 | Public Assistance–Child Support Payments, Non-Title IV-D | 777,454,864 |
| 7641 | Public Assistance–Temporary Assistance for Needy Families (TANF) | 96,075,667 |
| 7642 | Public Assistance–Child Support Payments, Title IV-D | 3,407,356,025 |
| 7643 | Other Financial Services | 81,449,913 |
| 7644 | Commodity Distribution Program | $352,427,615 |
| 7645 | Disaster Relief Payments | 2,723,636 |
| 7651 | Financial Services–Discharged Convicts | 4,046,075 |
| 7652 | Financial Services–Rehabilitation Clients | 224,511,585 |
| 7661 | Medical Services–Nursing Home Programs | 4,127,078,073 |
| 7662 | Vendor Drug Program | 1,890,449,612 |
| 7664 | Supplementary Medical Insurance Benefits | 1,041,713,032 |
| 7666 | Medical Services and Specialties | 18,625,578,332 |
| 7671 | Grants-in-Aid (Day Care) | 21,854 |
| 7672 | Grants-in-Aid (Foster Care) | 575,847,878 |
| 7673 | Grants-in-Aid (Care for Aged, Blind and Disabled) | 107,426,984 |
| 7674 | Grants-in-Aid (Services for Children/Clients) | 137,462,817 |
| 7676 | Grants-in-Aid (Transportation) | 186,562,542 |
| 7677 | Family Planning Services | 102,260,397 |
| 7678 | Employment Social Services | 94,866 |
| 7679 | Grants–College/Vocational Students | 53,498,122 |
| 7680 | Grants-in-Aid (Food) | 567,532,853 |
| 7681 | Grants–Survivors | 11,768,472 |
| 7829 | Disburse Medicaid Incentive Transfers to State Hospitals (UPL) | 163,039,955 |
| 7830 | Disbursement of Disproportionate Share Funds/State Hospitals | 285,703,533 |
| 7831 | Disbursement of Disproportionate Share Funds/Non-State Hospitals | 864,613,581 |
| 7832 | State Hospital Payments of State Matching Disproportionate Share and Upper Payment Limit (UPL) Funds | 451,943,488 |
| 7835 | Disbursement Medicaid Incentive Transfers to Urban/Rural Hospitals (UPL) | 2,583,719,060 |
| TOTAL PUBLIC ASSISTANCE PAYMENTS | $44,698,772,38 | |
| HIGHWAY CONSTRUCTION | ||
|---|---|---|
| 2012 Expenditures | ||
| 7347 | Real Property–Construction in Progress–Highway Network–Capitalized | $3,733,634,038 |
| 7348 | Real Property–Land/Highway Right-of-Way–Capitalized | 452,823,487 |
| 7397 | TxDOT Toll Road Expenditures–Construction | 0 |
| 7398 | TxDOT Toll Road Expense–Construction Engineering | (112,927) |
| 7399 | TxDOT Toll Road Expenditures–Right of Way | 0 |
| TOTAL HIGHWAY CONSTRUCTION | $4,186,344,597 | |
| OPERATING EXPENSES | ||
|---|---|---|
| 2012 Expenditures | ||
| Supplies and Materials | ||
| 7291 | Postal Services | $84,417,631 |
| 7300 | Consumables | 88,558,680 |
| 7303 | Subscriptions, Periodicals and Information Services | 5,717,112 |
| 7304 | Fuels and Lubricants–Other | 102,412,555 |
| 7307 | Fuels and Lubricants–Aircraft | 1,543,270 |
| 7310 | Chemicals and Gases | 7,916,096 |
| 7312 | Medical Supplies | 220,302,438 |
| 7315 | Food Purchased by the State | 1,420,032 |
| 7316 | Food Purchased for Wards of the State | 130,723,576 |
| 7322 | Personal Items–Wards of the State | 8,237,378 |
| 7324 | Credit Card Purchases for Clients or Wards of the State | 1,660,369 |
| 7325 | Services for Wards of the State | 45,702,709 |
| 7328 | Supplies/Materials–Agriculture, Construction and Hardware | 331,048,893 |
| 7330 | Parts–Furnishings and Equipment | 52,522,748 |
| 7331 | Plants | $2,243,117 |
| 7333 | Fabrics and Linens | 1,691,921 |
| TOTAL SUPPLIES AND MATERIALS | 1,086,118,524 | |
| Repairs and Maintenance | ||
| 7262 | Personal Property–Maintenance and Repair–Computer Software–Expensed | 111,614,636 |
| 7263 | Personal Property–Maintenance and Repair–Aircraft–Expensed | 1,818,078 |
| 7266 | Real Property–Buildings–Maintenance and Repair–Expensed | 123,353,817 |
| 7267 | Personal Property–Maintenance and Repair–Computer Equipment–Expensed | 54,539,055 |
| 7270 | Real Property–Infrastructure–Maintenance and Repair–Expensed | 546,025,683 |
| 7271 | Personal Property–Land–Maintenance and Repair–Expensed | 8,119,616 |
| 7338 | Real Property–Facilities and Other Improvements–Maintenance and Repairs–Expensed | 3,885,732 |
| 7354 | Leasehold Improvements–Expensed | 780,800 |
| 7358 | Real Property–Infrastructure–Preservation Costs–Expensed | (1,706) |
| 7367 | Personal Property–Maintenance and Repair–Expensed | 31,950,101 |
| 7368 | Personal Property–Maintenance and Repairs/Motor Vehicle–Expensed | 33,150,621 |
| 7514 | Real Property–Infrastructure/Telecommunications–Maintenance and Repair–Expensed | 19,019,718 |
| TOTAL REPAIRS AND MAINTENANCE | 934,256,153 | |
| Communication and Utilities | ||
| 7276 | Communication Services | 51,234,296 |
| 7293 | Statewide Telecommunications Network | 46,551,366 |
| 7501 | Electricity | 187,926,217 |
| 7502 | Natural and Liquefied Petroleum Gas | 16,016,994 |
| 7503 | Telecommunications–Long Distance | 1,345,787 |
| 7504 | Telecommunications–Monthly Charge | 29,642,113 |
| 7507 | Water | 36,181,803 |
| 7510 | Telecommunications–Parts and Supplies | 3,402,958 |
| 7516 | Telecommunications–Other Service Charges | 36,840,063 |
| 7517 | Personal Property–Telecommunications Equipment– Expensed | 6,913,670 |
| 7518 | Telecommunications–Dedicated Data Circuit | 1,381,154 |
| 7521 | Real Property–Infrastructure/Telecommunications Equipment–Expensed | 1,090,471 |
| 7522 | Telecommunications–Equipment Rental | 3,256,427 |
| 7524 | Other Utilities | 2,372,064 |
| 7526 | Waste Disposal | 36,455,192 |
| 7530 | Thermal Energy | 19,022,759 |
| TOTAL COMMUNICATION AND UTILITIES | 479,633,335 | |
| Rentals and Leases | ||
| 7401 | Rental of Radio Towers | 400,775 |
| 7406 | Rental of Furnishings and Equipment | 48,734,236 |
| 7411 | Rental of Computer Equipment | 33,487,170 |
| 7415 | Rental of Computer Software | 7,859,933 |
| 7421 | Rental of Reference Material | 1,089,751 |
| 7442 | Rental of Motor Vehicles | 1,752,401 |
| 7443 | Rental of Aircraft–Exempt | 2,261,317 |
| 7444 | Charter of Aircraft | (2,227) |
| 7445 | Rental of Aircraft | 118,972 |
| 7449 | Rental of Marine Equipment | $2,907 |
| 7461 | Rental of Land | 2,045,473 |
| 7462 | Rental of Office Buildings or Office Space | 155,135,862 |
| 7468 | Rental of Service Buildings | 4,208,534 |
| 7470 | Rental of Space | 15,211,613 |
| TOTAL RENTALS AND LEASES | 272,306,716 | |
| Printing and Reproduction | ||
| 7218 | Publications | 4,887,899 |
| 7273 | Reproduction and Printing Services | 34,374,395 |
| TOTAL PRINTING AND REPRODUCTION | 39,262,294 | |
| TOTAL OPERATING EXPENSES | $2,811,577,022 | |