Skip navigation

Top navigation skipped
Texas
Statewide Economic Snapshot
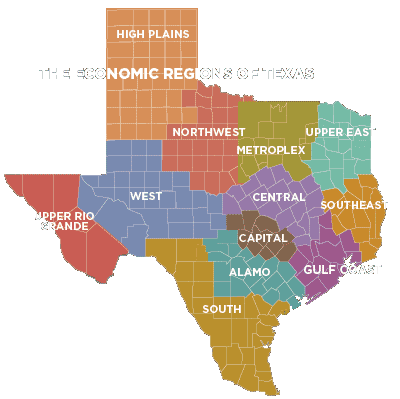
The Texas Comptroller’s office divides the state’s 268,000 square miles into 12 economic regions, each with at least one Census-defined metropolitan statistical area (MSA), urban areas with relatively high populations and close economic integration.
Glenn Hegar Texas Comptroller of Public Accounts
This analysis predates the COVID-19 crisis and the economic impacts that followed. It is offered as an overview of the statewide economy and a resource for comparative purposes.
Top 10 Industries by Location Quotient
- Oil and Gas Extraction
- Support Activities for Mining
- Pipeline Transportation
- Petroleum and Coal Products Manufacturing
- Heavy and Civil Engineering Construction
- Space Research and Technology
- Leather and Allied Product Manufacturing
- Air Transportation
- Museums, Historical Sites and Similar Institutions
- Support Activities for Transportation
Population Growth
TEXAS AND U.S., 2010 to 2019
Texas
15.3%
U.S.
5.5%
Source: U.S. Census Bureau
In 2019, Texas had an estimated population of 29 million, more than half of it concentrated in the Dallas-Fort Worth-Arlington MSA (26 percent) and Houston-The Woodlands-Sugarland MSA (24.1 percent). From 2010 to 2019, the state’s population rose more than twice as fast as the nation’s, at 15.3 percent vs. 6.3 percent.
Education
Average Annual Earnings by Educational Attainment, Texas
| Educational Attainment | Average Annual Earnings |
|---|---|
| Less than high school | $42,808 |
| High school or equivalent, no college | $52,035 |
| Some college or associate degree | $60,428 |
| Bachelor’s degree or advanced degree | $95,716 |
Sources: U.S. Census Bureau and JobsEQ
Texas workers with some college or associate degrees and stable jobs earned an average of $8,393 more annually than those with a high school degree, while those with at least a bachelor’s degree earned an average of $43,681 more.
Jobs & Wages
In 2019, more than 12.5 million persons were employed in Texas. From 2009 to 2019, the state’s job count rose by 22.3 percent, substantially outperforming national job growth.
Texas’ most significant occupations are shown below, sorted by numerical growth during the last five years
Employment growth, Texas vs. U.S.,
2009 to 2019
Note: Figures include private and public sector employees with the exception of active-duty military personnel, railroad employees, religious institution employees and the self-employed.
Sources: JobsEQ and U.S. Bureau of Labor Statistics
Top Occupations in Texas by Numeric Growth, 2014-2019
| Occupation | 2019 Employment | Average Annual Wages, 2018 |
|---|---|---|
| Personal Care and Service Workers (Other) | 315,623 | $22,300 |
| Animal Care and Service Workers | 18,324 | $24,200 |
| Sales Representatives, Services | 205,744 | $65,700 |
| Supervisors of Personal Care and Service Workers | 15,072 | $42,800 |
| Mathematical Science Occupations | 14,417 | $85,700 |
Note: Data are as of Q4 2019 except wage data,
which are for covered employment in 2018.
Source: JobsEQ
State Economy
In 2019, taxable sales directly attributable to businesses in the state exceeded $556.7 billion.
Revenue Subject To Sales Tax, Texas
| Year | Texas Revenue |
|---|---|
| 2007 | 330.3 billion dollars |
| 2008 | 349.7 billion dollars |
| 2009 | 315.4 billion dollars |
| 2010 | 326.1 billion dollars |
| 2011 | 361.9 billion dollars |
| 2012 | 398.6 billion dollars |
| 2013 | 421.8 billion dollars |
| 2014 | 456.2 billion dollars |
| 2015 | 457.9 billion dollars |
| 2016 | 453.6 billion dollars |
| 2017 | 483.1 billion dollars |
| 2018 | 526.2 billion dollars |
| 2019 | 556.7 billion dollars |
| Total | 4.88 trillion dollars |
Source: Texas Comptroller of Public Accounts
Summary
Each of Texas’ 12 economic regions features dominant industries unique to each, contributing to an economic diversity that helped the state navigate previous economic downturns.
The Texas economy has seen consistent growth in the last decade. The military and its supporting industries have had a positive impact on all of the state’s economic regions. Businesses supporting energy extraction and transportation are highly concentrated in Texas, making its economy unique among states.
View a complete list of the Comptroller’s 12 Economic regions, plus more in-depth county-by-county data.
Questions?
If you have any questions or concerns regarding the material on this page, please contact the Comptroller’s Data Analysis and Transparency Division.