Skip navigation

Top navigation skipped
Biennial Revenue Estimate: A Closer Look (PDF)
Biennial Revenue Estimate
A CLOSER LOOK
The Texas Comptroller provides the Biennial Revenue Estimate (BRE) at the beginning of every regular legislative session. The estimate outlines how much state revenue is available for lawmakers to spend on programs for Texans through the 2020-21 biennium.
Revenue Available for General Purpose Spending
In Billions of Dollars
| Revenue | 2018-19 | 2020-21 | |
|---|---|---|---|
| General Revenue-Related (GR-R) Tax Collections | $99.27 | $107.32 | |
| Other GR-R Revenues | plus$14.55 | plus$14.16 | |
| Total GR-R Revenues | equals$113.82 | equals$121.48 | SUBTOTAL |
| Beginning Balance | plus$1.94 | plus$4.18 | |
| Total GR-R Revenue & Fund Balances | equals$115.77 | equals$125.67 | SUBTOTAL |
| Revenue Reserved for Transfers to the Economic Stabilization and State Highway Funds | minus$5.57 | minus$6.34 | |
| Amount Needed for Texas Tomorrow Fund* | minus$0.00 | minus$0.21 | |
| Total Revenue Available for General-Purpose Spending | equals$110.20 | equals$119.12 | TOTAL |
* The original, constitutionally guaranteed prepaid tuition program is projected to have a cash shortfall of $211 million in the 2020-21 biennium. The BRE assumes the shortfall will be paid from general revenue.
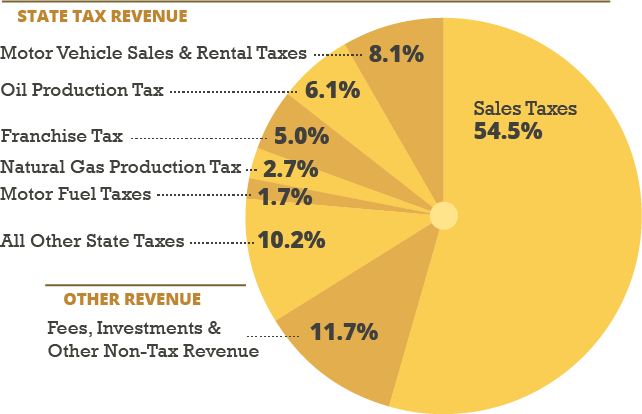
General Revenue-Related Revenues
| Revenue Source | Percent of Total |
|---|---|
| Sales Taxes | 54.5% |
| Motor Vehicle Sales and Rental Taxes | 8.1% |
| Oil Production Tax | 6.1% |
| Franchise Tax | 5.0% |
| Natural Gas Production Tax | 2.7% |
| Motor Fuel Taxes | 1.7% |
| All Other State Taxes | 10.2% |
| Other Revenue | 11.7% |
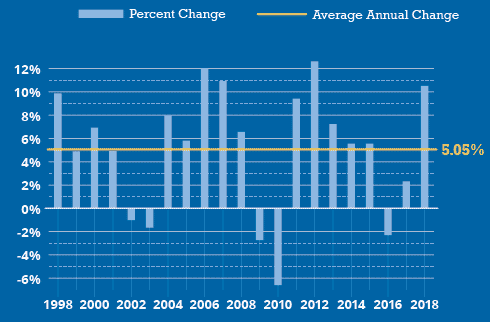
Annual Net Sales Tax Collections/All Funds
| Year | Percent Change |
|---|---|
| 1998 | 9.87% |
| 1999 | 4.89% |
| 2000 | 6.94% |
| 2001 | 4.91% |
| 2002 | -1.00% |
| 2003 | -1.65% |
| 2004 | 7.98% |
| 2005 | 5.81% |
| 2006 | 12.03% |
| 2007 | 10.92% |
| 2008 | 6.58% |
| 2009 | -2.73% |
| 2010 | -6.58% |
| 2011 | 9.42% |
| 2012 | 12.63% |
| 2013 | 7.24% |
| 2014 | 5.56% |
| 2015 | 5.57% |
| 2016 | -2.30% |
| 2017 | 2.32% |
| 2018 | 10.51% |
Average Annual Change: 5.05%
