Skip navigation

Top navigation skipped
Population Growth
Alamo REGION VS.
Economy
Regional Snapshot
Alamo
As the state’s chief financial officer, I am charged with monitoring the economic health of our state and its regions. The state of Texas has 12 economic regions including the Alamo Region.
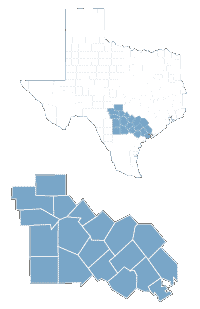
The 19-county Alamo Region covers about 18,000 square miles in south central Texas, stretching from Fredericksburg and Kerrville in the Hill Country to Port Lavaca on the Gulf Coast. Below we examine demographic and economic statistics that influence the region’s economy.
Glenn Hegar
Texas Comptroller of Public Accounts
Alamo Region Counties:
- ATASCOSA
- BANDERA
- BEXAR
- CALHOUN
- COMAL
- DEWITT
- FRIO
- GILLESPIE
- GOLIAD
- GONZALES
- GUADALUPE
- JACKSON
- KARNES
- KENDALL
- KERR
- LAVACA
- MEDINA
- VICTORIA
- WILSON
Concentrated Industries:
- PIPELINE TRANSPORTATION
- SUPPORT ACTIVITIES FOR MINING
- NATIONAL SECURITY AND INTERNATIONAL AFFAIRS
- DATA PROCESSING, HOSTING AND RELATED SERVICES
- OIL AND GAS EXTRACTION
- FISHING, HUNTING AND TRAPPING
- LEATHER AND ALLIED PRODUCT MANUFACTURING
- INSURANCE CARRIERS AND RELATED ACTIVITIES
- RENTAL AND LEASING SERVICES
- CREDIT INTERMEDIATION AND RELATED ACTIVITIES
Source: JobsEQ®
Population Growth
Alamo REGION VS.
TEXAS AND U.S., 2010-2017
Region
14.2%
U.S.
5.5%
Texas
12.6%
Source: U.S. Census Bureau
The Alamo Region’s estimated total population in 2017 was nearly 2.8 million, or approximately 10 percent of the state’s total population. This is an increase of more than 14 percent (nearly 350,000 people) since the 2010 census.
Economy
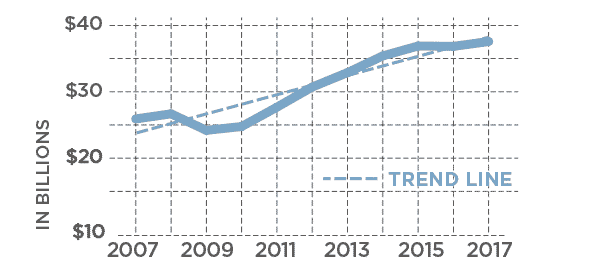
Regional Receipts Subject To Sales Tax, 2007-2017
Sales receipts subject to state sales tax directly attributed to the Alamo Region trended upward in the past decade.
| Year | Alamo Region |
|---|---|
| 2007 | $25,845,630,006 |
| 2008 | $26,555,746,316 |
| 2009 | $24,252,465,757 |
| 2010 | $24,787,051,843 |
| 2011 | $27,485,077,545 |
| 2012 | $30,294,047,726 |
| 2013 | $32,309,990,131 |
| 2014 | $34,639,805,128 |
| 2015 | $36,017,880,571 |
| 2016 | $35,968,995,113 |
| 2017 | $36,645,305,538 |
Source: Texas Comptroller of Public Accounts
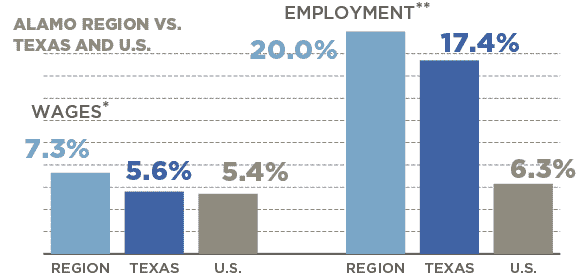
JOBS & WAGE CHANGES, 2007-2017
In 2017, the Alamo Region accounted for more than 9 percent of the state’s total employment.
| Area | Change in Wages* | Change in Jobs** |
|---|---|---|
| Alamo Region | 7.3% | 20% |
| Texas | 5.6% | 17.4% |
| U.S. | 5.4% | 6.3% |
*Real rate of change
**Figures include private and public sector employees with the exception of active-duty military
personnel, railroad employees, religious institution employees and the self-employed.
Sources: JobsEQ and U.S. Bureau of Labor Statistics
Conclusion
The Alamo Region and its 19 counties have many economic variables and challenges that are unique. The region as a whole is more diverse than the state, and every county in the region is growing. Household income is on par with the state, but a majority of counties outside of Bexar County show a median age significantly older than the state. The region’s job growth and wage growth are both slightly higher than the state. The region’s high school education attainment is growing, as is the local economy. While the federal government, including the U.S. military, has a large footprint in the region, businesses supporting the oil industry are highly concentrated in the region and continue to make the region’s economy robust.
The Alamo Region is one of the Comptroller’s 12 economic regions. View a complete list of these regions, plus more in-depth county-by-county data.
Questions?
If you have any questions or concerns regarding the material on this page, please contact the Comptroller’s Data Analysis and Transparency Division.