Skip navigation

Top navigation skipped
Population Growth
High Plains REGION VS.
Economy
Regional Snapshot
High Plains
As the state’s chief financial officer, I am charged with monitoring the economic health of our state and its regions. The state of Texas has 12 economic regions including the High Plains Region.
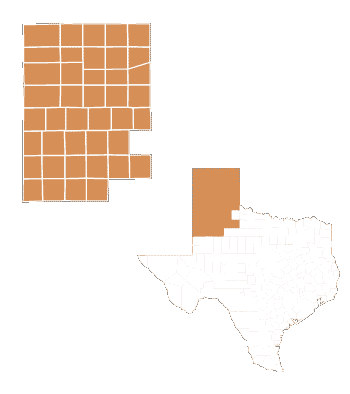
The 41-county High Plains Region covers about 39,500 square miles in north Texas, stretching from the Oklahoma state line on the the east and north, to the New Mexico state line on the west, to the Lubbock metro area on the south. Below we examine demographic and economic statistics that influence the region’s economy.
Glenn Hegar
Texas Comptroller of Public Accounts
High Plains Region Counties:
- Armstrong
- Bailey
- Briscoe
- Carson
- Castro
- Childress
- Cochran
- Collingsworth
- Crosby
- Dallam
- Deaf Smith
- Dickens
- Donley
- Floyd
- Garza
- Gray
- Hale
- Hall
- Hansford
- Hartley
- Hemphill
- Hockley
- Hutchinson
- King
- Lamb
- Lipscomb
- Lubbock
- Lynn
- Moore
- Motley
- Ochiltree
- Oldham
- Parmer
- Potter
- Randall
- Roberts
- Sherman
- Swisher
- Terry
- Wheeler
- Yoakum
Concentrated Industries:
- Animal Production and Aquaculture
- Oil and Gas Extraction
- Support Activities for Mining
- Leather and Allied Product Manufacturing
- Rail Transportation
- Pipeline Transportation
- Food Manufacturing
- Crop Production
- Petroleum and Coal Products Manufacturing
- Support Activities for Agriculture and Forestry
Source: JobsEQ®
Population Growth
High Plains REGION VS.
TEXAS AND U.S., 2010-2017
Region
3.9%
U.S.
5.5%
Texas
12.6%
Source: U.S. Census Bureau
The High Plains Region’s estimated total population in 2017 was 873,000, or more than 3 percent of the state’s total population. This is an increase of about 4 percent (more than 33,000 people) since the 2010 census.
Economy
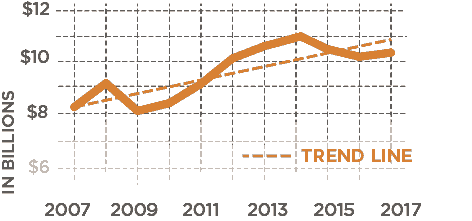
Regional Receipts Subject To Sales Tax, 2007-2017
Sales receipts subject to state sales tax directly attributable to the High Plains Region trended upward in the past decade.
| Year | High Plains Region |
|---|---|
| 2007 | $8,242,402,803 |
| 2008 | $9,110,526,831 |
| 2009 | $8,101,079,180 |
| 2010 | $8,382,057,874 |
| 2011 | $9,084,260,880 |
| 2012 | $10,013,530,403 |
| 2013 | $10,455,207,923 |
| 2014 | $10,995,788,789 |
| 2015 | $10,344,671,467 |
| 2016 | $10,070,340,326 |
| 2017 | $10,219,806,956 |
Source: Texas Comptroller of Public Accounts
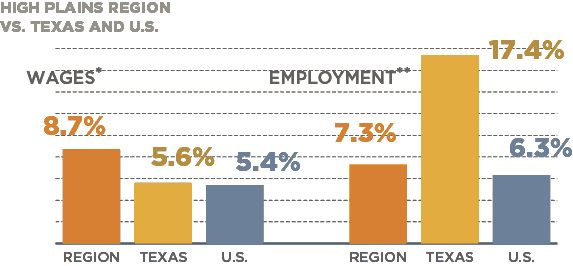
JOBS & WAGE CHANGES, 2007-2017
In 2017, the High Plains Region accounted for more than 3 percent of the state’s total employment.
| Area | Change in Wages* | Change in Jobs** |
|---|---|---|
| High Plains Region | 8.7% | 7.3% |
| Texas | 5.6% | 17.4% |
| U.S. | 5.4% | 6.3% |
*Real rate of change
**Figures include private and public sector employees with the exception of active-duty military
personnel, railroad employees, religious institution employees and the self-employed.
Sources: JobsEQ® and U.S. Bureau of Labor Statistics
Conclusion
The High Plains Region’s median age is on par with that of Texas; however, Lubbock County – the region’s most populous county – is significantly younger than the state as a whole. The high school graduation rate in the region is above the state average, and about 27 percent of the population is under 18 years of age.
Individual wages in the region are below the state average, but wages are increasing at a faster pace than the state average. The region’s local economy peaked in 2014, falling off since. However, sales receipts subject to state sales tax in 2017 indicate the local economy is regaining its upward trend. These economic factors, combined with the agriculture industry’s large footprint in the region, differentiate the High Plains regional economy.
The High Plains Region is one of the Comptroller’s 12 economic regions. View a complete list of these regions, plus more in-depth county-by-county data.
Questions?
If you have any questions or concerns regarding the material on this page, please contact the Comptroller’s Data Analysis and Transparency Division.