Skip navigation

Top navigation skipped
Population Growth
UPPER RIO GRANDE REGION VS.
Economy
Regional Snapshot
Upper Rio Grande
As the state’s chief financial officer, I am charged with monitoring the economic health of our state and its regions. The state of Texas has 12 economic regions including the Upper Rio Grande Region.
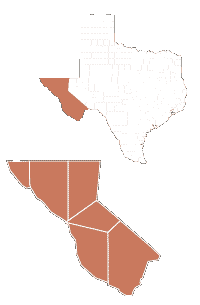
The six-county Upper Rio Grande Region covers about 21,700 square miles in westernmost Texas. It stretches from the extreme western part of the state, where it meets Mexico and New Mexico, along the Rio Grande past Big Bend and up to the New Mexico border around the area of Guadalupe Mountains National Park. Below we examine demographic economic statistics that influence the region’s economy.
Glenn Hegar
Texas Comptroller of Public Accounts
Upper Rio Grande Region Counties:
- Brewster
- Culberson
- El Paso
- Hudspeth
- Jeff Davis
- Presidio
Concentrated Industries:
- Leather and Allied Product Manufacturing
- Apparel Manufacturing
- Justice, Public Order and Safety Activities
- Petroleum and Coal Products Manufacturing
- Truck Transportation
- Museums, Historical Sites and Similar Institutions
- Primary Metal Manufacturing
- Administration of Housing Programs, Urban Planning and Community Development
- Electronics and Appliance Stores
- Clothing and Clothing Accessories Stores
Source: JobsEQ®
Population Growth
UPPER RIO GRANDE REGION VS.
TEXAS AND U.S., 2010-2017
Region
4.8%
U.S.
5.5%
Texas
12.6%
Source: U.S. Census Bureau
The Upper Rio Grande Region’s estimated total population in 2017 was about 866,000, or more than 3 percent of the state’s total population. This is an increase of about 5 percent (almost 40,000 people) since the 2010 census.
Economy
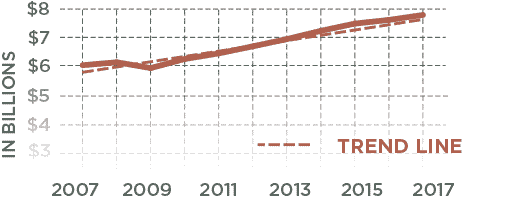
Regional Receipts Subject To Sales Tax, 2007-2017
Sales receipts subject to state sales tax directly attributed to the Upper Rio Grande Region trended upward in the past decade, with consistently positive movement since the 2009 recession.
| Year | Upper Rio Grande Region |
|---|---|
| 2007 | $6,009,324,227 |
| 2008 | $6,114,500,773 |
| 2009 | $5,908,965,400 |
| 2010 | $6,230,045,104 |
| 2011 | $6,429,204,261 |
| 2012 | $6,678,408,895 |
| 2013 | $6,935,699,064 |
| 2014 | $7,227,787,382 |
| 2015 | $7,484,966,828 |
| 2016 | $7,615,047,345 |
| 2017 | $7,791,072,923 |
Source: Texas Comptroller of Public Accounts
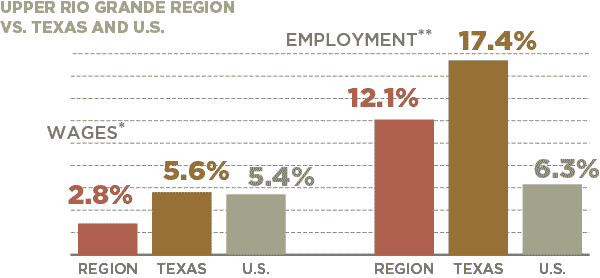
JOBS & WAGE CHANGES, 2007-2017
In 2017, the Upper Rio Grande Region accounted for about 2.6 percent of the state’s total employment.
| Area | Change in Wages* | Change in Jobs** |
|---|---|---|
| Upper Rio Grande Region | 2.8% | 12.1% |
| Texas | 5.6% | 17.4% |
| U.S. | 5.4% | 6.3% |
*Real rate of change
**Figures include private and public sector employees with the exception of active-duty military
personnel, railroad employees, religious institution employees and the self-employed.
Sources: JobsEQ and U.S. Bureau of Labor Statistics
Conclusion
The Upper Rio Grande Region and its six counties are predominantly rural with a strong urban core and a steady, consistent economy. El Paso County is home to 97 percent of the region’s population, which is significantly younger than the statewide average age. However, this is offset by the less populated counties, whose populations are all significantly older than the rest of the state. of the region’s households, 58 percent have average incomes less than $50,000.
Over the past decade, this region’s economy has been the most consistent with a gradual yet continuously positive trajectory. While the region’s most highly concentrated industries primarily revolve around manufacturing and public safety, the U.S. military base at fort Bliss has played a key role in keeping the region’s economy robust.
The Upper Rio Grande Region is one of the Comptroller’s 12 economic regions. View a complete list of these regions, plus more in-depth county-by-county data.
Questions?
If you have any questions or concerns regarding the material on this page, please contact the Comptroller’s Data Analysis and Transparency Division.