Skip navigation

Top navigation skipped
Economy
Texas Statewide Economic Snapshot
As the state’s chief financial officer, I monitor the economic health of our state and its regions.
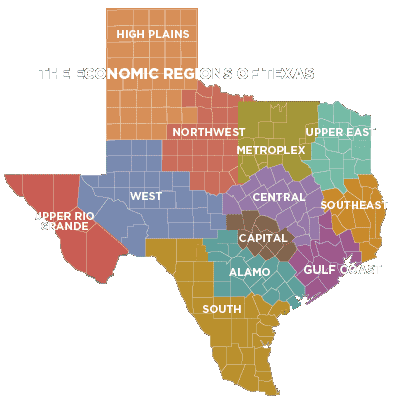
My office has divided the 268,000 square miles of Texas into 12 economic regions, each with at least one Census-defined metropolitan statistical area (MSA) considered to be an economic center or “focus” for that region. Below we examine demographic and economic statistics that influence the entire state’s economy.
Glenn Hegar
Texas Comptroller of Public Accounts
Population Growth TEXAS AND U.S., 2010-2017
Texas 12.6%
U.S. 5.5%
Source: U.S. Census Bureau
Texas had an estimated total population of
28.3 Million in 2017,
12.6 percent or 3 million more than
in the 2010 census.
Economy
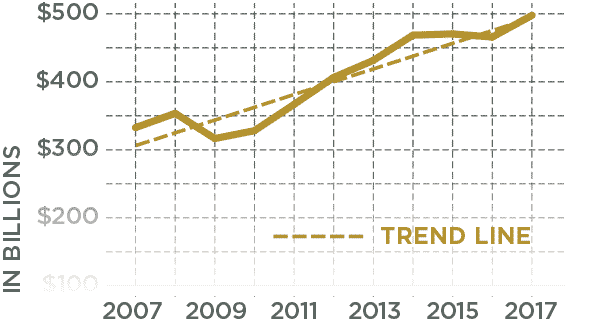
Receipts Subject To Sales Tax, 2007-2017
Sales receipts subject to Texas state sales tax trended upward in the past decade, with a significant climb following the 2009 recession. While the trend leveled off somewhat from 2014 to 2016, higher growth resumed in 2017.
| Year | Subject to Texas Sales Tax |
|---|---|
| 2007 | $330,278,179,769 |
| 2008 | $349,714,254,911 |
| 2009 | $315,364,296,469 |
| 2010 | $326,089,404,510 |
| 2011 | $361,942,118,931 |
| 2012 | $398,649,894,316 |
| 2013 | $421,844,060,026 |
| 2014 | $456,217,805,889 |
| 2015 | $457,879,905,244 |
| 2016 | $453,636,195,871 |
| 2017 | $483,135,308,754 |
Source: Texas Comptroller of Public Accounts
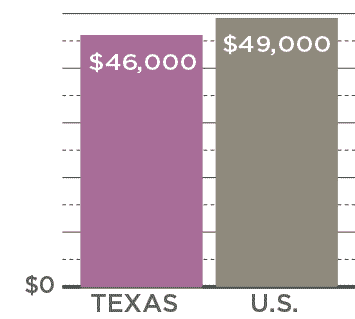
Income
Texas and U.S. Annual Per Capita Income, 2017
Source: U.S. Bureau of Labor Statistics
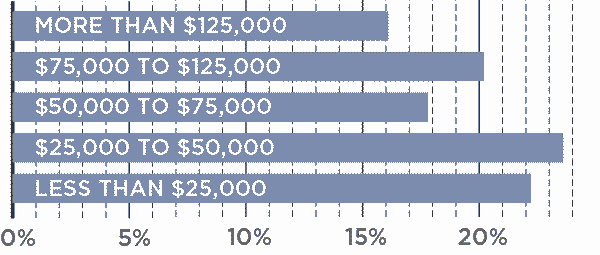
Texas Household Income, 2017
| Income Level | State Total |
|---|---|
| less than $25,000 | 22.2% |
| $25,000 to $50,000 | 23.6% |
| $50,000 to $75,000 | 17.8% |
| $75,000 to $125,000 | 20.2% |
| more than $125,000 | 16.1% |
Source: U.S. Census Bureau
Demographics
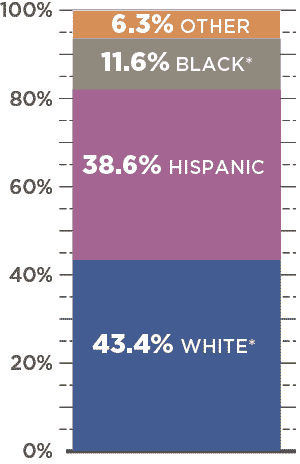
Texas Population by Ethnicity
Texas is an ethnically diverse state; 38.6 percent of its total population is Hispanic; and 11.6 percent of the population is Black (not Hispanic).
*Not Hispanic / Numbers may not add due to rounding.
Source: U.S. Census Bureau
Conclusion
Texas is both urban and rural, with a dynamic and diverse economy. Its economy has seen a steady upswing in the last 10 years, with the state’s economic diversity insulating Texas from the full effect of the 2009 recession and helping to mitigate the results of the oil price plunge in 2014.
Since the 2010 Census, Texas has added more than 3 million people. The state’s most populous counties, as well as all MSAs, have median ages on par with or younger than the state’s median of 34.2 years.
Unsurprisingly, businesses supporting the oil and gas industry are highly concentrated in the state. But, some of the highest annual wage increases during the last decade were in the air transportation subsector. The Texas economy’s strength can be illustrated by the increase in receipts subject to Texas state sales tax – about $170 billion (more than 50 percent) since the 2009. Consistent growth in the Capital and Metroplex regions has led the way. With continued economic vibrancy and diversity, Texas is poised to continue its historic economic success.
To see a complete list of the Comptroller’s 12 economic regions, plus more in-depth county-by-county data, visit the Economic Regions of Texas.
Questions?
If you have any questions or concerns regarding the material on this page, please contact the Comptroller’s Data Analysis and Transparency Division.