Skip navigation

Top navigation skipped
Population Growth
Upper East REGION VS.
Economy
Regional Snapshot
Upper East
As the state’s chief financial officer, I am charged with monitoring the economic health of our state and its regions. The state of Texas has 12 economic regions including the Upper East Region.
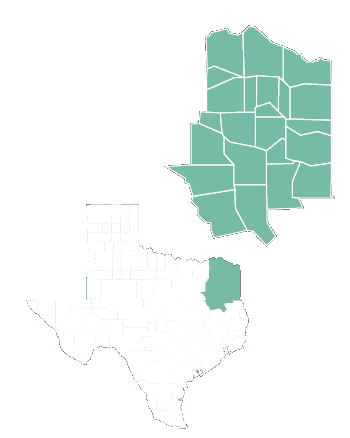
The 23-county Upper East Region encompasses about 16,000 square miles in the northeast corner of Texas, stretching from the Arkansas and Louisiana borders on the east to Cedar Creek Reservoir on the west. Below we examine demographic and economic statistics that influence the region’s economy.
Glenn Hegar
Texas Comptroller of Public Accounts
Upper East Region Counties:
- Anderson
- Bowie
- Camp
- Cass
- Cherokee
- Delta
- Franklin
- Gregg
- Harrison
- Henderson
- Hopkins
- Lamar
- Marion
- Morris
- Panola
- Rains
- Red River
- Rusk
- Smith
- Titus
- Upshur
- Van Zandt
- Wood
Concentrated Industries:
- Support Activities for Mining
- Pipeline Transportation
- Oil and Gas Extraction
- Wood Product
- Manufacturing
- Forestry and Logging
- Animal Production and Aquaculture
- Paper Manufacturing
- Petroleum and Coal Products Manufacturing
- Food Manufacturing
- Heavy and Civil Engineering Construction
Source: JobsEQ®
Population Growth
Upper East REGION VS.
TEXAS AND U.S., 2010-2017
Region
2.9%
U.S.
5.5%
Texas
12.6%
Source: U.S. Census Bureau
The Upper East Region’s estimated total population in 2017 was 1.14 million, or nearly 4 percent of the state’s total population. This is an increase of 3 percent (more than 32,000 people) since the 2010 census.
Economy
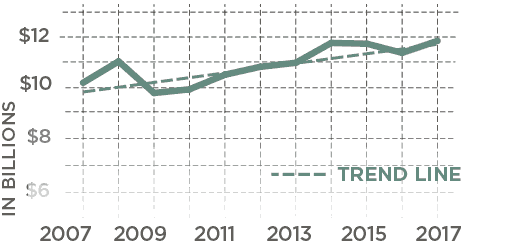
Regional Receipts Subject To Sales Tax, 2007-2017
Sales receipts subject to state sales tax directly attributable to the Upper East Region have trended upward in the past decade.
| Year | Upper East Region |
|---|---|
| 2007 | $10,077,896,974 |
| 2008 | $10,872,249,312 |
| 2009 | $9,697,277,606 |
| 2010 | $9,833,398,095 |
| 2011 | $10,376,029,054 |
| 2012 | $10,671,559,318 |
| 2013 | $10,819,907,108 |
| 2014 | $11,557,686,863 |
| 2015 | $11,529,632,444 |
| 2016 | $11,190,625,633 |
| 2017 | $11,633,255,832 |
Source: Texas Comptroller of Public Accounts
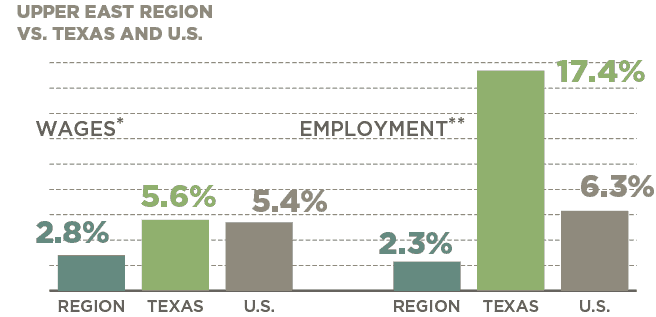
JOBS & WAGE CHANGES, 2007-2017
In 2017, the Upper East Region accounted for 3.5 percent of the state’s total employment.
| Area | Change in Wages* | Change in Jobs** |
|---|---|---|
| Upper East Region | 2.8% | 2.3% |
| Texas | 5.6% | 17.4% |
| U.S. | 5.4% | 6.3% |
*Real rate of change
**Figures include private and public sector employees with the exception of active-duty military
personnel, railroad employees, religious institution employees and the self-employed.
Sources: JobsEQ® and U.S. Bureau of Labor Statistics
Conclusion
The Upper East Region and its 23 counties have many economic variables and challenges that are unique. The economic hub is Smith County, the region’s most populous county as well as the fastest growing.
The region has seen limited population growth since 2010; its median age is significantly older than the state’s as a whole; and average household income is less than the statewide average. The U.S. military’s presence has had a positive economic impact on the region, however, and most of the top 10 most concentrated industries saw a significant rise in average wages from 2007 to 2017. The region’s high school graduation rate has reliably outperformed the state’s rate year after year, and the local economy has seen a steady increase in receipts subject to state sales tax since the 2009 recession.
The Upper East Region is one of the Comptroller’s 12 economic regions. View a complete list of these regions, plus more in-depth county-by-county data.
Questions?
If you have any questions or concerns regarding the material on this page, please contact the Comptroller’s Data Analysis and Transparency Division.