Skip navigation

Top navigation skipped
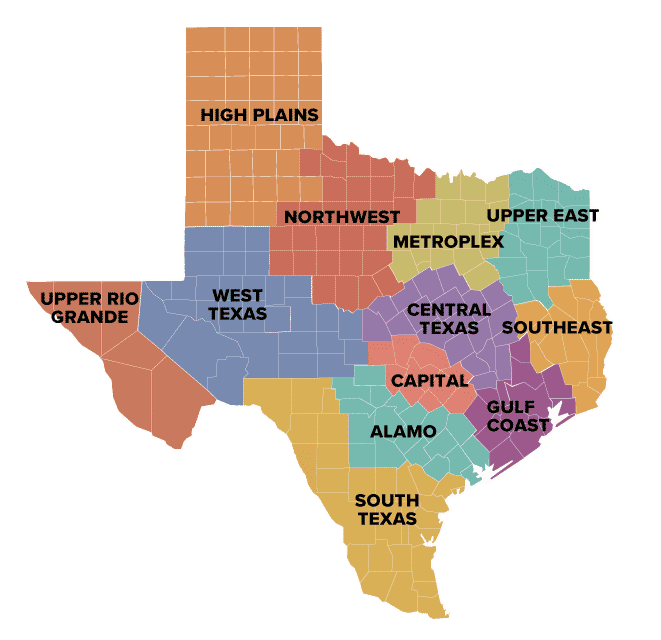
The Texas Comptroller’s office divides the state’s 268,000 square miles into 12 economic regions, each with at least one Census-defined metropolitan statistical area (MSA), urban areas with relatively high populations and close economic integration.
Glenn Hegar
Texas Comptroller of Public Accounts
| Texas Statistics and State Rank in the U.S. | Texas | State Rank |
|---|---|---|
| Square Miles | 268,597 | 2 |
| Population, 2020 Census | 29,145,505 | 2 |
| Population Percent Change, 2010 to 2020 | 15.9% | 3 |
| Population over 25 with at Least a High School Diploma, 2019 | 83.7% | 49 |
| Population over 25 with Bachelor’s Degree or Higher, 2019 | 29.9% | 28 |
| Per Capita Income, 2019 | $52,813 | 26 |
| Median Household Income, 2019 | $61,874 | 22 |
| Population Age 65 or Over, 2019 | 12.9% | 48 |
| Population Under Age 18, 2019 | 25.5% | 2 |
Population Change
TEXAS
15.9%
U.S.
7.4%
Texas’ population rose by about 16 percent between 2010 and 2020, compared to a 7.4 percent increase nationwide. Population growth was strongest in the Capital region (31.5 percent), followed by the Gulf Coast (19.9 percent), Metroplex (19.5 percent), and Alamo (17.5 percent) regions.
Jobs & Wages
Percent change in total jobs, 2010 to 2020
Texas: 17.1%, U.S.: 7.8%
Texas added more than 1.9 million jobs between 2010 and 2015, an increase of 17.1 percent, more than double the national growth rate. Energy-related industries are highly concentrated in Texas, as measured by location quotient (LQ). An LQ of 1.25 or higher indicates that the industry enjoys a competitive advantage in the region compared to other areas.
Jobs in logistics and delivery industries saw strong growth in recent years, as did services related to computer systems design and technical consulting.
Health care and education-related industries employ the largest numbers of Texans. While the most concentrated industries by LQ are indicative of the state’s history as an energy producer.
Top Industries by Location Quotient, 2020
| Industry | Employment | Average Annual Wages | Location Quotient |
|---|---|---|---|
| Oil and Gas Extraction | 71,923 | $205,352 | 6.03 |
| Pipeline Transportation of Crude Oil | 6,059 | $124,293 | 5.58 |
| Support Activities for Mining | 111,870 | $101,438 | 5.28 |
| Pipeline Transportation of Natural Gas | 11,727 | $177,443 | 4.27 |
| Basic Chemical Manufacturing | 34,854 | $134,507 | 2.66 |
Industries with Largest Total Jobs Growth, 2015 to 2020
| Industry | Average Annual Wages | Employment Change, 2015 to 2020 | Percent Change, 2015 to 2020 |
|---|---|---|---|
| Warehousing and Storage | $41,592 | 67,129 | 120.8% |
| Computer Systems Design and Related Services | $116,443 | 46,581 | 27.6% |
| Management, Scientific and Technical Consulting Services | $96,878 | 38,571 | 27.2% |
| Individual and Family Services | $29,011 | 33,030 | 26.8% |
| Couriers and Express Delivery Services | $39,990 | 24,828 | 57.9% |
THE Texas REGION IS ONE OF THE COMPTROLLER’S 12 ECONOMIC REGIONS.
Sources: JobsEQ; U.S. Bureau of Labor Statistics Quarterly Census of Employment and Wages; U.S. Census Bureau; U.S. Bureau of Economic Analysis, Texas Comptroller of Public Accounts