Skip navigation

Top navigation skipped
Population Growth
Capital REGION VS.
Economy
Regional Snapshot
Capital
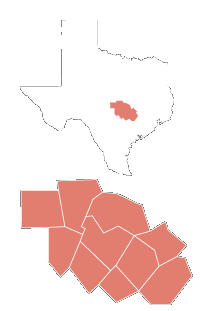
As the state’s chief financial officer, I am charged with monitoring the economic health of our state and its regions. The state of Texas has 12 economic regions including the Capital Region.
The 10-county Capital Region covers about 8,600 square miles in central Texas, stretching from Llano to San Marcos and from La Grange to Georgetown. Below we examine demographic and economic statistics that influence the region’s economy.
Glenn Hegar
Texas Comptroller of Public Accounts
Capital Region Counties:
- Bastrop
- Blanco
- Burnet
- Caldwell
- Fayette
- Hays
- Lee
- Llano
- Travis
- Williamson
Concentrated Industries:
- Computer and Electronic Product Manufacturing
- Funds, Trusts and Other Financial Vehicles
- Data Processing, Hosting and Related Services
- Museums, Historical Sites and Similar Institutions
- Administration of Human Resource Programs
- Administration of Environmental Quality Programs
- Heavy and Civil Engineering Construction
- Merchant Wholesalers, Durable Goods
- Telecommunications
- Professional, Scientific and Technical Services
Source: JobsEQ®
Population Growth
Capital REGION VS.
TEXAS AND U.S., 2010-2017
Region
22.4%
U.S.
5.5%
Texas
12.6%
Source: U.S. Census Bureau
The Capital Region’s estimated total population in 2017 was 2.1 million, or nearly 8 percent of the state’s total population. This is an increase of 22 percent (more than 400,000 people) since the 2010 census.
Economy
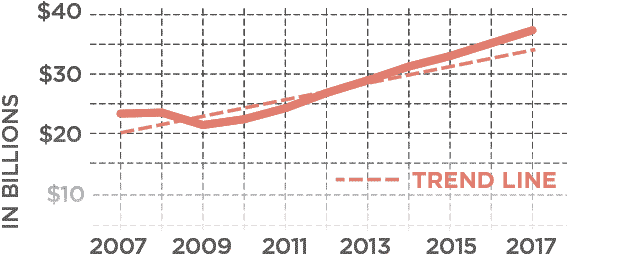
Regional Receipts Subject To Sales Tax, 2007-2017
Receipts subject to state sales tax directly attributed to the Capital Region trended upward in the past decade with an almost 70 percent climb since the 2009 recession.
| Year | Capital Region |
|---|---|
| 2007 | $23,267,117,612 |
| 2008 | $23,427,541,345 |
| 2009 | $21,491,231,443 |
| 2010 | $22,395,326,073 |
| 2011 | $24,116,546,011 |
| 2012 | $26,494,079,033 |
| 2013 | $28,459,835,702 |
| 2014 | $30,610,734,288 |
| 2015 | $32,243,756,987 |
| 2016 | $34,246,387,029 |
| 2017 | $36,252,254,799 |
Source: Texas Comptroller of Public Accounts
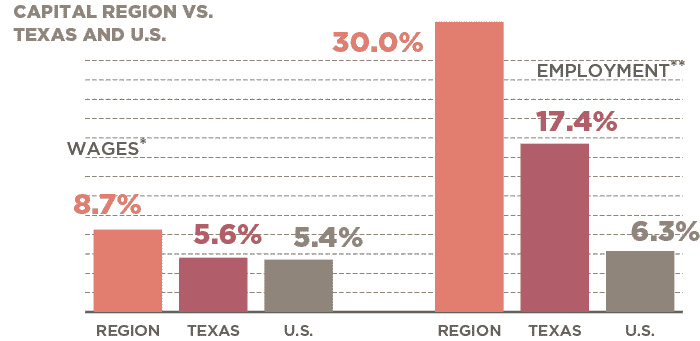
JOBS & WAGE CHANGES, 2007-2017
In 2017, the Capital Region accounted for more than 8.5 percent of the state’s total employment.
| Area | Change in Wages* | Change in Jobs** |
|---|---|---|
| Capital Region | 8.7% | 30% |
| Texas | 5.6% | 17.4% |
| U.S. | 5.4% | 6.3% |
*Real rate of change
**Figures include private and public sector employees with the exception of active-duty military
personnel, railroad employees, religious institution employees and the self-employed.
Sources: JobsEQ and U.S. Bureau of Labor Statistics
Conclusion
The Capital Region and its 10 counties have many economic variables and challenges that are unique. This region touts a highly educated population with high income and low unemployment.
If this region were a state, it would have the second-highest share of population 25 and older with at least a bachelor’s degree. The region has had a population growth of 22 percent since 2010, with more than 43 percent of households having incomes over $75,000.
The Capital Region’s local economy has demonstrated strong, steady and consistent growth. The region boasts a large concentration of industries surrounding the technology sector and has maintained a high employment growth rate from 2007 to 2017, combined with high average wages. The U.S. Army’s selection of the region for the location of its Futures Command will add to this positive economic growth.
The Capital Region is one of the Comptroller’s 12 economic regions. View a complete list of these regions, plus more in-depth county-by-county data.
Questions?
If you have any questions or concerns regarding the material on this page, please contact the Comptroller’s Data Analysis and Transparency Division.