Skip navigation

Top navigation skipped

Population Growth
Central REGION VS.
Economy
Regional Snapshot
Central Texas
As the state’s chief financial officer, I am charged with monitoring the economic health of our state and its regions. The state of Texas has 12 economic regions including the Central Texas Region.
The 20-county Central Texas Region covers about 17,400 square miles in the heart of Texas, stretching from Hillsboro on the north to Interstate 45 on the east to East Yegua Creek on the south to the conjunction of the San Saba and Colorado rivers. Below we examine demographic and economic statistics that influence the region’s economy.
Glenn Hegar
Texas Comptroller of Public Accounts
Central Region Counties:
- Bell
- Bosque
- Brazos
- Burleson
- Coryell
- Falls
- Freestone
- Grimes
- Hamilton
- Hill
- Lampasas
- Leon
- Limestone
- Madison
- Mclennan
- Milam
- Mills
- Robertson
- San Saba
- Washington
Concentrated Industries:
- Lessors of Nonfinancial Intangible Assets (Except Copyrighted Works)
- Animal Production and Aquaculture
- Support Activities for Mining
- Mining (Except Oil and Gas)
- Heavy and Civil Engineering Construction
- Pipeline Transportation
- Justice, Public Order, and Safety Activities
- Educational Services
- Furniture and Related Product Manufacturing
- Paper Manufacturing
Source: JobsEQ®
Population Growth
Central REGION VS.
TEXAS AND U.S., 2010-2017
Region
7.9%
U.S.
5.5%
Texas
12.6%
Source: U.S. Census Bureau
The Central Texas Region’s estimated total population in 2017 was 1.2 million, or about 4.6 percent of the state’s total population. This is an increase of about 8 percent (more than 88,000 people) since the 2010 census.
Economy
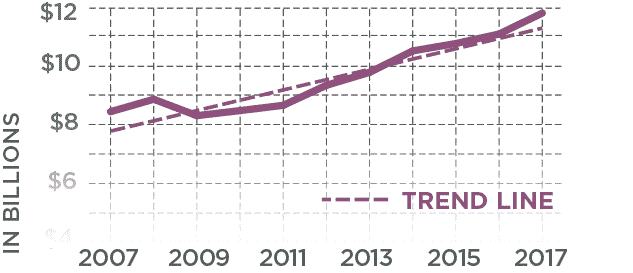
Regional Receipts Subject To Sales Tax, 2007-2017
Sales receipts subject to state sales tax directly attributable to the Central Texas Region demonstrated a slow and steady increase following the 2009 recession.
| Year | Central Texas Region |
|---|---|
| 2007 | $8,434,453,199 |
| 2008 | $8,854,932,724 |
| 2009 | $8,299,606,602 |
| 2010 | $8,470,853,653 |
| 2011 | $8,649,940,393 |
| 2012 | $9,329,117,482 |
| 2013 | $9,768,284,216 |
| 2014 | $10,496,600,193 |
| 2015 | $10,747,187,652 |
| 2016 | $11,068,430,975 |
| 2017 | $11,777,704,697 |
Source: Texas Comptroller of Public Accounts
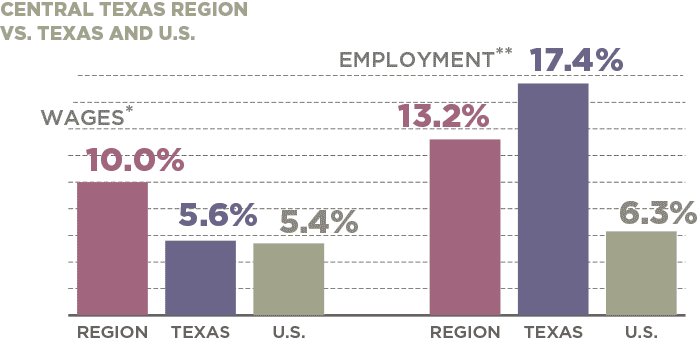
JOBS & WAGE CHANGES, 2007-2017
In 2017, the Central Texas Region accounted for 3.6 percent of the state’s total employment.
| Area | Change in Wages* | Change in Jobs** |
|---|---|---|
| Central Region | 10.0% | 13.2% |
| Texas | 5.6% | 17.4% |
| U.S. | 5.4% | 6.3% |
*Real rate of change
**Figures include private and public sector employees with the exception of active-duty military
personnel, railroad employees, religious institution employees and the self-employed.
Sources: JobsEQ® and U.S. Bureau of Labor Statistics
Conclusion
The Central Texas Region is unique in that it has three distinct economic centers: the Waco, Killeen-Temple and College Station-Bryan metropolitan statistical areas (MSAs).
The region has had reasonable population growth across the board since 2010, and its median age is significantly younger than Texas as a whole. The region’s employment growth rate is slightly below the state’s, but its wage growth is almost double that of the state (Killeen-Temple MSA leads the way regionally).
The U.S. Army at fort Hood has had a meaningful impact on the Central Texas Region’s local economies. Additionally, 2017 receipts subject to state sales tax indicate an acceleration in the region’s slow and steady rise after the 2009 recession. The eight distinct industry subsectors represented in the region’s most highly concentrated industries list attest to the region’s diverse economy.
The Central Region is one of the Comptroller’s 12 economic regions. View a complete list of these regions, plus more in-depth county-by-county data.
Questions?
If you have any questions or concerns regarding the material on this page, please contact the Comptroller’s Data Analysis and Transparency Division.