Skip navigation

Top navigation skipped
Population Growth
Gulf Coast REGION VS.
Economy
Regional Snapshot
Gulf Coast
As the state’s chief financial officer, I am charged with monitoring the economic health of our state and its regions. The state of Texas has 12 economic regions including the Gulf Coast Region.
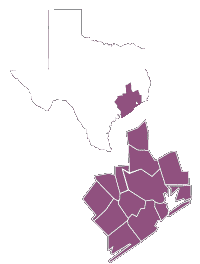
The 13-county Gulf Coast Region covers about 13,900 square miles in eastern coastal Texas, stretching from Huntsville on the north to Matagorda Bay and Galveston along the Gulf Coast. Below we examine demographic and economic statistics that influence the region’s economy.
Glenn Hegar
Texas Comptroller of Public Accounts
Gulf Coast Region Counties:
- Austin
- Brazoria
- Chambers
- Colorado
- Fort Bend
- Galveston
- Harris
- Liberty
- Matagorda
- Montgomery
- Walker
- Waller
- Wharton
Concentrated Industries:
- Oil and Gas Extraction
- Pipeline Transportation
- Space Research and Technology
- Support Activities for Mining
- Petroleum and Coal
- Products Manufacturing
- Water Transportation
- Chemical
- Manufacturing
- Heavy and Civil Engineering
- Construction
- Air Transportation
- Support Activities for Transportation
Source: JobsEQ®
Population Growth
Gulf Coast REGION VS.
TEXAS AND U.S., 2010-2017
Region
16.1%
U.S.
5.5%
Texas
12.6%
Source: U.S. Census Bureau
The Gulf Coast Region’s estimated total population in 2017 was more than 7 million, or nearly 25 percent of the state’s total population. This is an increase of about 16 percent (almost 1 million people) since the 2010 census.
Economy
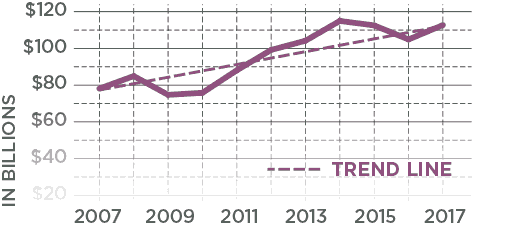
Regional Receipts Subject To Sales Tax, 2007-2017
Receipts subject to state sales tax directly attributed to the Gulf Coast Region trended upward in the past decade.
| Year | Gulf Coast Region |
|---|---|
| 2007 | $77,517,449,043 |
| 2008 | $83,829,444,811 |
| 2009 | $74,359,526,514 |
| 2010 | $75,385,416,896 |
| 2011 | $86,742,722,896 |
| 2012 | $97,015,304,616 |
| 2013 | $101,662,951,434 |
| 2014 | $111,635,368,667 |
| 2015 | $109,403,474,564 |
| 2016 | $102,309,042,600 |
| 2017 | $109,545,581,485 |
Source: Texas Comptroller of Public Accounts
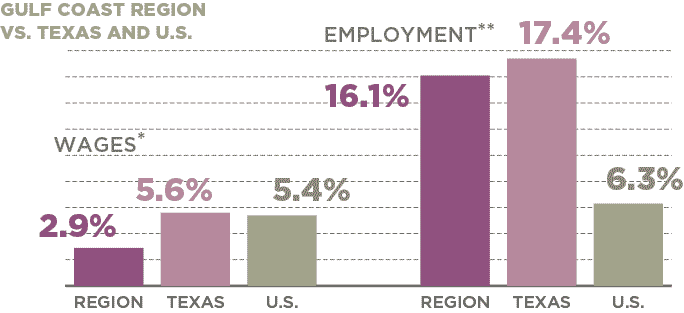
JOBS & WAGE CHANGES, 2007-2017
In 2017, the Gulf Coast Region accounted for nearly 25 percent of the state’s total employment, making this region the second-largest employment base in the state.
| Area | Change in Wages* | Change in Jobs** |
|---|---|---|
| Gulf Coast Region | 2.9% | 16.1% |
| Texas | 5.6% | 17.4% |
| U.S. | 5.4% | 6.3% |
*Real rate of change
**Figures include private and public sector employees with the exception of active-duty military
personnel, railroad employees, religious institution employees and the self-employed.
Sources: JobsEQ® and U.S. Bureau of Labor Statistics
Conclusion
The Gulf Coast Region and its 13 counties contain 25 percent of the state’s population, growing 16 percent since 2010, and is the most diverse region in Texas. If this region were a state, it would be the 14th most populous. While the region’s median age is on par with that of the state, it has the largest percentage of households with income over $125,000.
The region added more than 400,000 jobs from 2007 to 2017, and the average wage is significantly higher than the state average. The local economy is strong, with about 23 percent of the state’s overall sales tax revenue coming from the Gulf Coast Region. Industry concentration in the region primarily revolves around the production of chemical and petroleum products, as well as certain transportation sectors, all contributing positively to this unique local economy.
The Gulf Coast Region is one of the Comptroller’s 12 economic regions. View a complete list of these regions, plus more in-depth county-by-county data.
Questions?
If you have any questions or concerns regarding the material on this page, please contact the Comptroller’s Data Analysis and Transparency Division.