Skip navigation

Top navigation skipped
Population Growth
Metroplex REGION VS.
Economy
Regional Snapshot
Metroplex
As the state’s chief financial officer, I am charged with monitoring the economic health of our state and its regions. The state of Texas has 12 economic regions including the Metroplex Region.
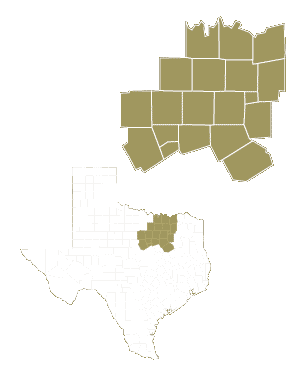
The 19-county Metroplex Region covers about 15,600 square miles in northern Texas, stretching from Oklahoma south to the Brazos River and from the Cedar Creek Reservoir on the east to Possum Kingdom Lake on the west. Below we examine demographic and economic statistics that influence the region’s economy.
Glenn Hegar
Texas Comptroller of Public Accounts
Metroplex Region Counties:
- Collin
- Cooke
- Dallas
- Denton
- Ellis
- Erath
- Fannin
- Grayson
- Hood
- Hunt
- Johnson
- Kaufman
- Navarro
- Palo Pinto
- Parker
- Rockwall
- Somervell
- Tarrant
- Wise
Concentrated Industries:
- Oil and Gas Extraction
- Air Transportation
- Monetary Authorities - Central Bank
- Telecommunications
- Data Processing, Hosting and Related Services
- Credit Intermediation and Related Activities
- Computer and Electronic
- Product Manufacturing
- Warehousing and Storage
- Museums, Historical Sites and Similar Institutions
- Support Activities for Mining
Source: JobsEQ®
Population Growth
Metroplex REGION VS.
TEXAS AND U.S., 2010-2017
Region
14.7%
U.S.
5.5%
Texas
12.6%
Source: U.S. Census Bureau
The Metroplex Region’s estimated total population in 2017 was about 7.4 million, or more than 27 percent of the state’s total population. This is an increase of about 15 percent (almost 1 million people) since the 2010 census.
Economy
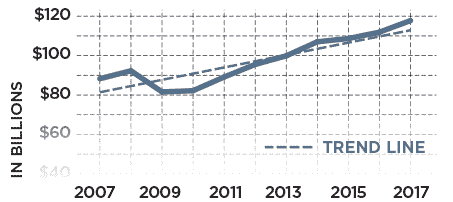
Regional Receipts Subject To Sales Tax, 2007-2017
Receipts subject to state sales tax directly attributed to the Metroplex Region trended upward in the past decade, with a significant climb following the 2009 recession.
| Year | Metroplex Region |
|---|---|
| 2007 | $87,663,528,441 |
| 2008 | $91,374,649,634 |
| 2009 | $81,458,979,930 |
| 2010 | $82,029,529,433 |
| 2011 | $88,452,775,588 |
| 2012 | $94,361,060,508 |
| 2013 | $98,400,588,022 |
| 2014 | $105,006,058,208 |
| 2015 | $106,525,098,761 |
| 2016 | $109,536,444,883 |
| 2017 | $114,957,533,055 |
Source: Texas Comptroller of Public Accounts
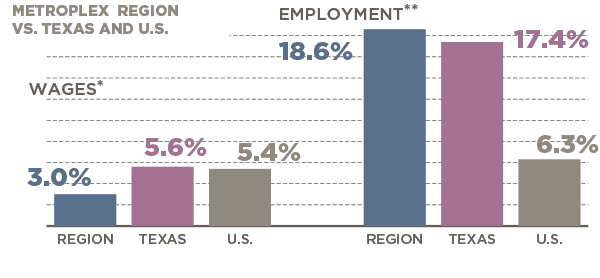
JOBS & WAGE CHANGES, 2007-2017
In 2017, the Metroplex Region accounted for nearly 30 percent of the state’s total employment, making this region the largest employment base in the state.
| Area | Change in Wages* | Change in Jobs** |
|---|---|---|
| Metroplex Region | 3% | 18.6% |
| Texas | 5.6% | 17.4% |
| U.S. | 5.4% | 6.3% |
*Real rate of change
**Figures include private and public sector employees with the exception of active-duty military
personnel, railroad employees, religious institution employees and the self-employed.
Sources: JobsEQ and U.S. Bureau of Labor Statistics
Conclusion
The Metroplex Region and its 19 counties have many economic variables and challenges that are unique. The region has similar racial diversity as Texas and contains 27 percent of the state’s population. All counties in this region are experiencing population growth. If this region were a state, it would be the 13th most populated. The region’s high school graduation rate mirrors the state’s rates, and there are many options for higher educational achievement.
The local economy is strong and accounts for about 24 percent of the state’s overall sales tax revenue collections. The region added more than 550,000 jobs between 2007 and 2017 and had job growth at a higher rate than the state. However, it is the concentration of high-paying, high-growth industries (including air transportation, money and banking and technology) that makes the region’s economy distinctive.
The Metroplex Region is one of the Comptroller’s 12 economic regions. View a complete list of these regions, plus more in-depth county-by-county data.
Questions?
If you have any questions or concerns regarding the material on this page, please contact the Comptroller’s Data Analysis and Transparency Division.