Skip navigation

Top navigation skipped
Population Growth
NORTHWEST REGION VS.
Economy
Regional Snapshot
Northwest
As the state’s chief financial officer, I am charged with monitoring the economic health of our state and its regions. The state of Texas has 12 economic regions including the Northwest Region.
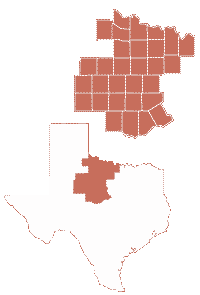
The 30-county Northwest Region covers about 27,600 square miles in northern Texas, stretching from Oklahoma on the north to the Colorado River on the south, and abutting Big Spring on the west and the Fort Worth metro on the east. Below we examine demographic and economic statistics that influence the region’s economy.
Glenn Hegar
Texas Comptroller of Public Accounts
Northwest Region Counties:
- Archer
- Baylor
- Brown
- Callahan
- Clay
- Coleman
- Comanche
- Cottle
- Eastland
- Fisher
- Foard
- Hardeman
- Haskell
- Jack
- Jones
- Kent
- Knox
- Mitchell
- Montague
- Nolan
- Runnels
- Scurry
- Shackelford
- Stephens
- Stonewall
- Taylor
- Throckmorton
- Wichita
- Wilbarger
- Young
Concentrated Industries:
- Rail Transportation
- Support Activities For Mining
- Oil and Gas Extraction
- Leather and Allied Product Manufacturing
- Pipeline Transportation
- Animal Production and Aquaculture
- Nonmetallic Mineral Product Manufacturing
- Justice, Public Order and Safety Activities
- Gasoline Stations
- National Security and International Affairs
Source: JobsEQ®
Population Growth
NORTHWEST REGION VS.
TEXAS AND U.S., 2010-2017
Region
-0.2%
U.S.
5.5%
Texas
12.6%
Source: U.S. Census Bureau
The Northwest Region’s estimated total population in 2017 was about 549,000, or nearly 2 percent of the state’s total population. Population in this region has remained stable since the 2010 census.
Economy
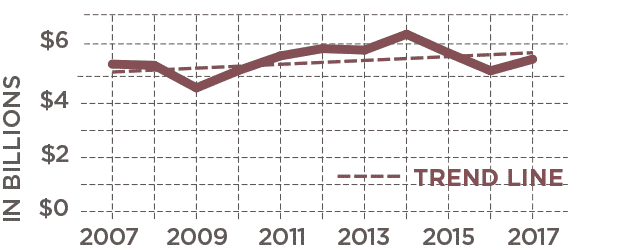
Regional Receipts Subject To Sales Tax, 2007-2017
Sales receipts subject to state sales tax directly attributable to the Northwest Region trended slightly upward but fluctuated around the trend line in the past decade.
| Year | Northwest Region |
|---|---|
| 2007 | $5,306,497,917 |
| 2008 | $5,266,046,250 |
| 2009 | $4,493,006,016 |
| 2010 | $5,088,183,888 |
| 2011 | $5,589,162,530 |
| 2012 | $5,839,276,169 |
| 2013 | $5,787,644,697 |
| 2014 | $6,330,946,563 |
| 2015 | $5,686,812,383 |
| 2016 | $5,079,445,566 |
| 2017 | $5,475,828,715 |
Source: Texas Comptroller of Public Accounts
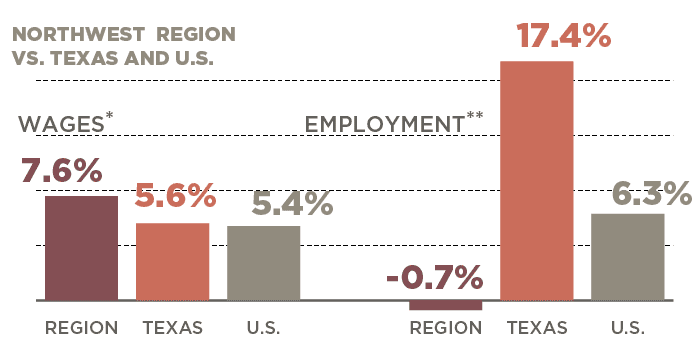
JOBS & WAGE CHANGES, 2007-2017
In 2017, the Northwest Region accounted for approximately 2 percent of the state’s total employment.
| Area | Change in Wages* | Change in Jobs** |
|---|---|---|
| Northwest Region | 7.6% | -0.7% |
| Texas | 5.6% | 17.4% |
| U.S. | 5.4% | 6.3% |
*Real rate of change
**Figures include private and public sector employees with the exception of active-duty military
personnel, railroad employees, religious institution employees and the self-employed.
Sources: JobsEQ and U.S. Bureau of Labor Statistics
Conclusion
The Northwest Region and its 30 counties has many economic variables and challenges that are unique. The region is significantly older than the state as a whole and is less diverse with the lowest percentage of minority groups. Population growth has been stable since 2010, and there was a loss of jobs in the region from 2007 to 2017. However, individual wages have increased at a rate higher than the state as a whole. The high school graduation rate has increased almost 6.5 percent since 2010, consistently outperforming the rest of the state. The region’s receipts subject to state sales tax have had a positive upward trend following the 2009 recession, with a peak in 2014. Sales tax receipts from 2017 indicate this regional economy is regaining momentum.
The Northwest Region is one of the Comptroller’s 12 economic regions. View a complete list of these regions, plus more in-depth county-by-county data.
Questions?
If you have any questions or concerns regarding the material on this page, please contact the Comptroller’s Data Analysis and Transparency Division.