Skip navigation

Top navigation skipped
Population Growth
SOUTHEAST REGION VS.
Economy
Regional Snapshot
Southeast
As the state’s chief financial officer, I am charged with monitoring the economic health of our state and its regions. The state of Texas has 12 economic regions including the Southeast Region.
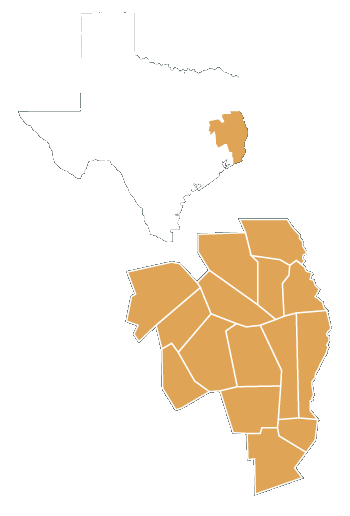
The 15-county Southeast Region covers about 12,800 square miles in easternmost Texas, stretching from the Gulf of Mexico to Nacogdoches along the Louisiana border. Below we examine demographic and economic statistics that influence the region’s economy.
Glenn Hegar
Texas Comptroller of Public Accounts
Southeast Region Counties:
- Angelina
- Hardin
- Houston
- Jasper
- Jefferson
- Nacogdoches
- Newton
- Orange
- Polk
- Sabine
- San Augustine
- San Jacinto
- Shelby
- Trinity
- Tyler
Concentrated Industries:
- Petroleum and Coal
- Products Manufacturing
- Forestry and Logging
- Pipeline Transportation
- Chemical Manufacturing
- Wood Product
- Manufacturing
- Heavy and Civil Engineering Construction
- Construction of Buildings
- Support Activities for Mining
- Justice, Public Order and Safety Activities
- Paper Manufacturing
Source: JobsEQ®
Population Growth
SOUTHEAST REGION VS.
TEXAS AND U.S., 2010-2017
Region
2%
U.S.
5.5%
Texas
12.6%
Source: U.S. Census Bureau
The Southeast Region has seen limited population growth since 2010, and residents of 14 of its 15 counties are significantly older than the state’s median age. However, Nacogdoches County has a significantly younger population than the state.
Economy
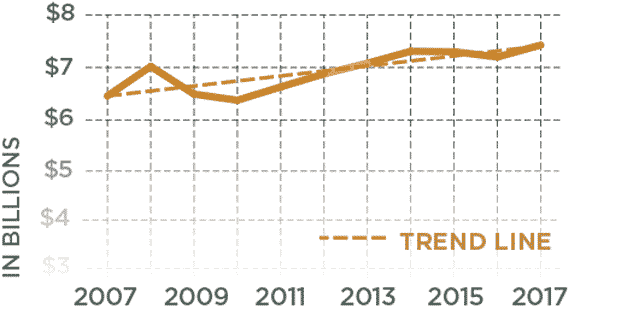
Regional Receipts Subject To Sales Tax, 2007-2017
Sales receipts subject to state sales tax directly attributable to the Southeast Region trended upward in the past decade.
| Year | Southeast Region |
|---|---|
| 2007 | $6,460,924,971 |
| 2008 | $7,021,582,817 |
| 2009 | $6,495,404,231 |
| 2010 | $6,380,563,564 |
| 2011 | $6,633,000,036 |
| 2012 | $6,880,663,472 |
| 2013 | $7,081,774,651 |
| 2014 | $7,309,071,262 |
| 2015 | $7,300,392,403 |
| 2016 | $7,199,656,596 |
| 2017 | $7,426,568,464 |
Source: Texas Comptroller of Public Accounts
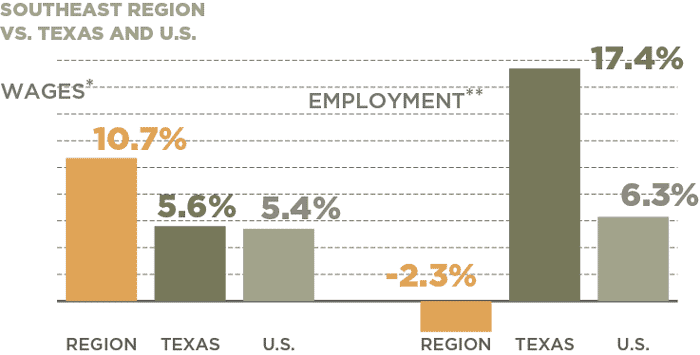
JOBS & WAGE CHANGES, 2007-2017
In 2017, the Southeast Region accounted for approximately 2 percent of the state’s total employment.
| Area | Change in Wages* | Change in Jobs** |
|---|---|---|
| Southeast Region | 10.7% | -2.3% |
| Texas | 5.6% | 17.4% |
| U.S. | 5.4% | 6.3% |
*Real rate of change
**Figures include private and public sector employees with the exception of active-duty military
personnel, railroad employees, religious institution employees and the self-employed.
Sources: JobsEQ and U.S. Bureau of Labor Statistics
Conclusion
The Southeast Region took longer than most regions in Texas to recover from the 2009 recession. However, the trend has been upward since then, with receipts subject to state sales tax continuing to grow in 2017. While the region has had slower employment growth than the rest of the state, the average wage increase was double the state average between 2007 and 2017. The most concentrated industries in the region involve chemical and petroleum products production and construction services, which add to the vibrancy of the Southeast Region’s economy.
The Southeast Region is one of the Comptroller’s 12 economic regions. View a complete list of these regions, plus more in-depth county-by-county data.
Questions?
If you have any questions or concerns regarding the material on this page, please contact the Comptroller’s Data Analysis and Transparency Division.