Skip navigation

Top navigation skipped
Population Growth
West Texas REGION VS.
Economy
Regional Snapshot
West Texas
As the state’s chief financial officer, I am charged with monitoring the economic health of our state and its regions. The state of Texas has 12 economic regions including the West Region.
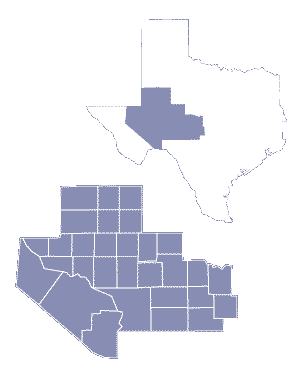
The 19-county West Region covers about 15,600 square miles in northern Texas, stretching from Oklahoma south to the Brazos River and from the Cedar Creek Reservoir on the east to Possum Kingdom Lake on the west. Below we examine demographic and economic statistics that influence the region’s economy.
Glenn Hegar
Texas Comptroller of Public Accounts
West Texas Region Counties:
- Andrews
- Borden
- Coke
- Concho
- Crane
- Crockett
- Dawson
- Ector
- Gaines
- Glasscock
- Howard
- Irion
- Kimble
- Loving
- Martin
- Mason
- Mcculloch
- Menard
- Midland
- Pecos
- Reagan
- Reeves
- Schleicher
- Sterling
- Sutton
- Terrell
- Tom Green
- Upton
- Ward
- Winkler
Concentrated Industries:
- Support Activities for Mining
- Oil and Gas Extraction
- Pipeline Transportation
- Heavy and Civil Engineering Construction
- Rental and Leasing Services
- Animal Production and Aquaculture
- Mining (Except Oil and Gas)
- Truck Transportation
- Gasoline Stations
- Fishing, Hunting and Trapping
Source: JobsEQ®
Population Growth
West Texas REGION VS.
TEXAS AND U.S., 2010-2017
Region
11.2%
U.S.
5.5%
Texas
12.6%
Source: U.S. Census Bureau
The West Texas Region’s estimated total population in 2017 was approximately 636,000, or about 2.2 percent of the state’s total population. This is an increase of 11.2 percent (more than 64,000 people) since the 2010 census.
Economy
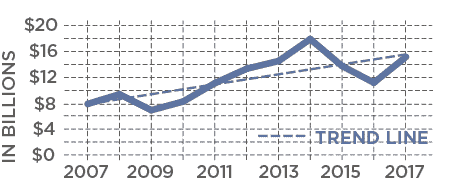
Regional Receipts Subject To Sales Tax, 2007-2017
While sales receipts subject to state sales tax directly attributable to the West Texas Region trended upward in the past decade, this region has been the most volatile since the 2009 recession.
| Year | West Texas Region |
|---|---|
| 2007 | $8,038,473,442 |
| 2008 | $9,426,388,320 |
| 2009 | $7,144,895,779 |
| 2010 | $8,380,875,048 |
| 2011 | $11,022,939,654 |
| 2012 | $13,463,436,972 |
| 2013 | $14,429,205,550 |
| 2014 | $17,712,486,753 |
| 2015 | $13,479,870,166 |
| 2016 | $11,087,394,470 |
| 2017 | $15,246,297,537 |
Source: Texas Comptroller of Public Accounts
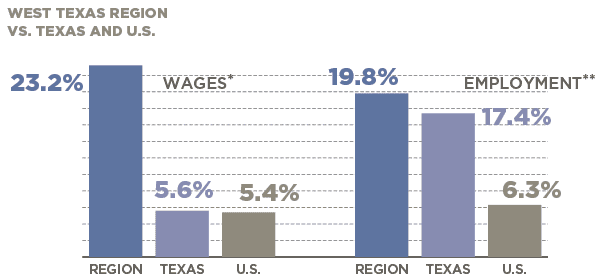
JOBS & WAGE CHANGES, 2007-2017
In 2017, the West Texas Region accounted for more than 2 percent of the state’s total employment.
| Area | Change in Wages* | Change in Jobs** |
|---|---|---|
| West Region | 23.2% | 19.8% |
| Texas | 5.6% | 17.4% |
| U.S. | 5.4% | 6.3% |
*Real rate of change
**Figures include private and public sector employees with the exception of active-duty military
personnel, railroad employees, religious institution employees and the self-employed.
Sources: JobsEQ and U.S. Bureau of Labor Statistics
Conclusion
The West Texas Region and its 30 counties have a combined median age of its residents that is slightly younger than the state as a whole. Hispanic and non-Hispanic whites split 93 percent of the region’s population almost evenly.
The West Texas Region has had the most volatile local economies during the past 10 years, and there has been significant job growth in the region as well. If the region were a state, it would have the sixth highest per capita income in the nation. The high concentration of industries revolving primarily around the extraction and transportation of natural resources differentiates the West Texas Region from other regions in Texas.
The West Texas Region is one of the Comptroller’s 12 economic regions. View a complete list of these regions, plus more in-depth county-by-county data.
Questions?
If you have any questions or concerns regarding the material on this page, please contact the Comptroller’s Data Analysis and Transparency Division.