Skip navigation

Top navigation skipped
Manufacturing in the High Plains Region
The 41-county High Plains Region stretches from the Oklahoma state line in the east and north and the New Mexico state line in the west to the Lubbock metropolitan area in the south.
The High Plains Region includes two metropolitan statistical areas (MSAs): the Amarillo MSA, comprising Armstrong, Carson, Oldham, Potter and Randall counties, and the Lubbock MSA, comprising Crosby, Lubbock and Lynn counties. The region’s counties not associated with an MSA include Bailey, Briscoe, Castro, Childress, Cochran, Collingsworth, Dallam, Deaf Smith, Dickens, Donley, Floyd, Garza, Gray, Hale, Hall, Hansford, Hartley, Hemphill, Hockley, Hutchinson, King, Lamb, Lipscomb, Moore, Motley, Ochiltree, Parmer, Roberts, Sherman, Swisher, Terry, Wheeler and Yoakum counties.
In 2019, the High Plains Region had an estimated population of 872,000, about 3 percent of Texas’ total population, and accounted for 3 percent of the state’s total employment.
The region included more than 31,200 manufacturing jobs in 2019, about 7 percent of its total employment of nearly 372,400. The sector’s contribution to regional gross domestic product (GDP) was much larger, however, in a testament to the region’s high-value manufacturing production. The manufacturing sector’s regional GDP of nearly $8.6 billion accounted for 17.3 percent of the total regional GDP of $49.6 billion. The High Plains Region’s manufacturers paid annual average wages of nearly $61,000 in 2019, compared to average wages of $46,880 for all regional jobs.
Manufacturing played a particularly significant role in some of the region’s smaller counties. In Gray County, home to Pampa, manufacturing accounted for about 16 percent of total employment and almost 30 percent of total GDP. The county’s manufacturing jobs paid average wages of nearly $87,000 in 2019. Manufacturing accounts for one in five jobs in Deaf Smith County, home to Hereford, the “Beef Capital of the World” (Exhibit 1).
Exhibit 1: Manufacturing Overview by County, High Plains Region, 2019
| County | Employment | Gross Domestic Product | Average Annual Wages |
||
|---|---|---|---|---|---|
| Total | Share | Total (millions) | Share | ||
| Armstrong | 11 | 2.6% | (D) | (D) | $31,729 |
| Bailey | 121 | 4.8% | $23.8 | 5.7% | $40,628 |
| Briscoe | 15 | 4.2% | (D) | (D) | $46,330 |
| Carson | 3,491 | 69.6% | (D) | (D) | $131,187 |
| Castro | 37 | 1.5% | $13.1 | 1.9% | $59,158 |
| Childress | 17 | 0.7% | (D) | (D) | $25,550 |
| Cochran | 49 | 7.1% | (D) | (D) | $36,413 |
| Collingsworth | 24 | 2.8% | $2.2 | 2.5% | $39,138 |
| Crosby | 13 | 1.0% | (D) | (D) | $37,869 |
| Dallam | 685 | 15.2% | $100.6 | 13.0% | $56,088 |
| Deaf Smith | 1,576 | 20.3% | $160.5 | 10.2% | $51,693 |
| Dickens | 0 | 0.0% | $0.6 | 0.5% | |
| Donley | 3 | 0.3% | (D) | (D) | $34,703 |
| Floyd | 47 | 3.0% | $3.8 | 0.9% | $38,164 |
| Garza | 21 | 1.1% | (D) | (D) | $90,906 |
| Gray | 1,228 | 15.9% | $332.6 | 29.5% | $86,810 |
| Hale | 662 | 5.6% | $99.6 | 7.1% | $49,081 |
| Hall | 25 | 3.2% | $2.7 | 3.3% | $30,687 |
| Hansford | 53 | 2.5% | $8.9 | 1.5% | $40,624 |
| Hartley | 107 | 4.0% | (D) | (D) | $32,755 |
| Hemphill | 52 | 2.6% | $8.0 | 1.4% | $68,250 |
| Hockley | 195 | 2.0% | $31.0 | 1.7% | $45,568 |
| Hutchinson | 931 | 11.6% | $5,650.8 | 86.2% | $107,684 |
| King | 0 | 0.0% | $0.2 | 0.2% | |
| Lamb | 189 | 4.6% | $15.6 | 2.0% | $47,898 |
| Lipscomb | 348 | 25.4% | (D) | (D) | $49,830 |
| Lubbock | 4,754 | 3.4% | $534.2 | 3.7% | $48,678 |
| Lynn | 42 | 2.7% | $2.9 | 1.1% | $35,743 |
| Moore | 3,792 | 33.7% | (D) | (D) | $42,900 |
| Motley | 17 | 5.3% | (D) | (D) | $30,316 |
| Ochiltree | 18 | 0.4% | $7.4 | 0.7% | $68,502 |
| Oldham | 12 | 1.1% | (D) | (D) | $44,310 |
| Parmer | 2,141 | 36.6% | (D) | (D) | $38,896 |
| Potter | 8,732 | 11.3% | $1,281.0 | 14.7% | $49,549 |
| Randall | 1,443 | 4.4% | $236.1 | 5.9% | $58,467 |
| Roberts | 0 | 0.0% | $0.3 | 0.1% | |
| Sherman | 55 | 5.3% | (D) | (D) | $19,451 |
| Swisher | 97 | 5.2% | $9.0 | 1.7% | $41,444 |
| Terry | 183 | 5.0% | $22.2 | 3.5% | $42,440 |
| Wheeler | 10 | 0.5% | $1.5 | 0.3% | $63,159 |
| Yoakum | 56 | 1.5% | $10.6 | 0.5% | $82,179 |
| High Plains Region Total | 31,251 | 8.4% | $8,559 | 17.3% | $60,614 |
| Texas | 908,801 | 7.2% | $241,005 | 13.1% | $79,746 |
(D): data not shown to avoid disclosure of confidential information.
Sources: JobsEQ, U.S. Bureau of Economic Analysis and Texas Comptroller of Public Accounts
The region’s cities, counties, colleges and manufacturers are working collaboratively to foster a skilled workforce and a competitive manufacturing sector. Examples include:
- The South Plains Association of Governments offers a revolving loan fund where businesses in select counties meeting certain criteria are eligible for a low-interest loan to expand. This includes machinery, equipment and buildings.
- The Panhandle Regional Planning Commission works with local governments in planning, developing and implementing programs designed to improve general health, safety and welfare.
- Amarillo College runs a training program with Bell Helicopter, training more than 1,000 employees as of 2019. Additionally, Frank Phillips College offers certificates in various technical fields and has the largest training facility for petrochemical and refining operations in the Texas Panhandle.
- The bottled water manufacturer Panhandle Pure LLC is expanding in Amarillo. A subsidiary of grocery wholesaler Affiliated Foods, Panhandle is renovating an old building in downtown Amarillo. It is spending $9-$11 million on the project and plans to create up to 30 new jobs.
- Witt Machine & Tool Co. moved from Colorado to Childress in 2020 and has hired six local employees with plans to hire more.
Long-Term Regional Trends
Between 2001 and 2019, manufacturing employment in the High Plains Region fell by about 2.2 percent or about 700 jobs. Manufacturing’s share of total regional employment fell from 9.8 percent to 8.4 percent during this period (Exhibit 2).
Exhibit 2: Manufacturing Employment and Manufacturing Share of Total Employment, 2001 to 2019, High Plains Region
| Year | Total Industry Jobs | Manufacturing Jobs | Manufacturing Share of Total Industry Jobs |
|---|---|---|---|
| 2001 | 326,824 | 31,958 | 9.8% |
| 2002 | 323,755 | 31,088 | 9.6% |
| 2003 | 323,069 | 30,873 | 9.6% |
| 2004 | 328,170 | 30,595 | 9.3% |
| 2005 | 332,282 | 30,437 | 9.2% |
| 2006 | 338,521 | 31,660 | 9.4% |
| 2007 | 344,121 | 32,146 | 9.3% |
| 2008 | 352,955 | 33,460 | 9.5% |
| 2009 | 344,980 | 32,067 | 9.3% |
| 2010 | 344,299 | 32,436 | 9.4% |
| 2011 | 350,669 | 33,309 | 9.5% |
| 2012 | 354,362 | 33,382 | 9.4% |
| 2013 | 358,285 | 31,508 | 8.8% |
| 2014 | 364,119 | 30,968 | 8.5% |
| 2015 | 366,543 | 29,853 | 8.1% |
| 2016 | 367,325 | 29,545 | 8.0% |
| 2017 | 369,113 | 30,436 | 8.2% |
| 2018 | 370,848 | 30,758 | 8.3% |
| 2019 | 372,376 | 31,251 | 8.4% |
Sources: JobsEQ and Texas Comptroller of Public Accounts
The region lost more than 800 manufacturing jobs, a 2.5 percent decline, between 2009 and 2019. Texas and U.S. manufacturing employment, by contrast, rose by 8.0 percent and 8.2 percent, respectively (Exhibit 3). The region’s manufacturing employment recovered between 2016 and 2019, led by gains in food manufacturing, plastics and rubber products and machinery manufacturing.
Exhibit 3: Percentage Change in Manufacturing Jobs, 2009 to 2019 (Indexed to 2009)
| Year | High Plains Region Jobs | High Plains Region Percent Change | Texas Percent Change | USA Percent Change |
|---|---|---|---|---|
| 2009 | 32,067 | 0.0% | 0.0% | 0.0% |
| 2010 | 32,436 | 1.2% | -3.2% | -2.7% |
| 2011 | 33,309 | 3.9% | -0.1% | -0.9% |
| 2012 | 33,382 | 4.1% | 3.1% | 0.8% |
| 2013 | 31,508 | -1.7% | 4.3% | 1.6% |
| 2014 | 30,968 | -3.4% | 5.8% | 2.9% |
| 2015 | 29,853 | -6.9% | 4.7% | 4.1% |
| 2016 | 29,545 | -7.9% | 0.8% | 4.1% |
| 2017 | 30,436 | -5.1% | 1.5% | 5.1% |
| 2018 | 30,758 | -4.1% | 4.9% | 7.1% |
| 2019 | 31,251 | -2.5% | 8.0% | 8.2% |
Sources: JobsEQ and Texas Comptroller of Public Accounts
Between 2009 and 2019, the High Plains Region lost 31 manufacturing establishments, a 4.1 percent decrease, versus gains of more than 9 percent in Texas and 1 percent in the U.S. (Exhibit 4).
Exhibit 4: Total Manufacturing Establishments, High Plains Region, 2009 to 2019
| Year | High Plains Region (total) | High Plains Region | Texas | USA |
|---|---|---|---|---|
| 2009 | 762 | 0.0% | 0.0% | 0.0% |
| 2010 | 760 | -0.3% | -1.4% | -2.5% |
| 2011 | 763 | 0.1% | -1.6% | -4.0% |
| 2012 | 750 | -1.6% | -1.9% | -4.7% |
| 2013 | 750 | -1.6% | -2.0% | -4.7% |
| 2014 | 743 | -2.5% | -1.4% | -3.9% |
| 2015 | 742 | -2.6% | 0.4% | -3.0% |
| 2016 | 733 | -3.8% | 1.7% | -2.2% |
| 2017 | 737 | -3.3% | 3.8% | -1.3% |
| 2018 | 720 | -5.5% | 5.7% | 0.0% |
| 2019 | 731 | -4.1% | 9.4% | 1.1% |
Sources: JobsEQ and Texas Comptroller of Public Accounts
The region’s manufacturing jobs paid average wages of $60,614 in 2019, less than the Texas and U.S. averages (Exhibit 5). Between 2009 and 2019, its average wages rose by 32.3 percent, versus 32 percent in Texas and 27.4 percent in the U.S.
Exhibit 5: Average Wages in Manufacturing Jobs, 2009 to 2019
| Year | High Plains Region | Texas | USA | ||
|---|---|---|---|---|---|
| 2009 | $45,803 | $60,401 | $54,939 | ||
| 2010 | $46,673 | $63,310 | $57,595 | ||
| 2011 | $48,253 | $66,075 | $59,277 | ||
| 2012 | $49,957 | $68,491 | $60,553 | ||
| 2013 | $51,754 | $68,838 | $61,143 | ||
| 2014 | $52,614 | $71,171 | $63,024 | ||
| 2015 | $53,454 | $72,815 | $64,352 | ||
| 2016 | $55,423 | $73,125 | $64,922 | ||
| 2017 | $56,407 | $75,806 | $66,898 | ||
| 2018 | $59,196 | $77,647 | $68,585 | ||
| 2019 | $60,614 | $79,746 | $69,976 | ||
| Percent Change, 2009 to 2019 | 32.3% | 32.0% | 27.4% |
Sources: JobsEQ and Texas Comptroller of Public Accounts
The region’s manufacturing GDP rose by an inflation-adjusted 167.6 percent between 2009 and 2019. The sector’s 10-year GDP changes in Texas and the U.S., by contrast, were 29.7 percent and 20.8 percent, respectively (Exhibit 6). A significant portion of regional gains in manufacturing GDP occurred in Hutchinson County.
Exhibit 6: Percentage Change in Real Gross Domestic Product, Manufacturing, 2009 to 2019 (Indexed to 2009)
| Year | High Plains Region | Texas | USA |
|---|---|---|---|
| 2009 | 0.0% | 0.0% | 0.0% |
| 2010 | -24.1% | 10.8% | 5.4% |
| 2011 | -24.3% | 15.0% | 5.8% |
| 2012 | -26.3% | 10.9% | 5.1% |
| 2013 | 87.3% | 23.3% | 8.3% |
| 2014 | 156.5% | 11.3% | 10.2% |
| 2015 | 102.2% | 15.0% | 11.7% |
| 2016 | 192.7% | 11.7% | 10.9% |
| 2017 | 149.9% | 18.2% | 13.7% |
| 2018 | 148.0% | 24.4% | 18.5% |
| 2019 | 167.6% | 29.7% | 20.8% |
Note: Due to GDP data withheld to avoid disclosure of confidential information, the analysis excludes the High Plains Region counties of Armstrong, Bailey, Briscoe, Carson, Childress, Cochran, Collingsworth, Crosby, Dickens, Donley, Garza, Hall, Hartley, Lipscomb, Lynn, Moore, Motley, Oldham, Parmer, Sherman and Wheeler.
Sources: U.S Bureau of Economic Analysis and Texas Comptroller of Public Accounts
Pandemic Effects
All Texas industry sectors have been affected by the pandemic to some degree, and manufacturing is no exception. However, monthly jobs data show that manufacturing jobs in the two High Plains Region’s MSAs had small changes in February 2021 compared to the previous year. The Amarillo MSA gained 100 jobs (or 0.7 percent), and the Lubbock MSA lost 100 jobs (-2 percent). This minimal impact stands in contrast to manufacturing job declines in Texas (-6.0 percent) and the U.S. (-4.1 percent) during this period (Exhibit 7).
Exhibit 7: Changes in Manufacturing Jobs, February 2020 to February 2021
| Metro Area | Manufacturing Jobs | Percent Change (Manufacturing) | Percent Change (Total Employment) |
|---|---|---|---|
| Amarillo | 100 | 0.7% | -2.1% |
| Lubbock | -100 | -2.0% | -2.4% |
| Texas | -54,200 | -6.0% | -4.6% |
| United States | -524,000 | -4.1% | -6.0% |
Note: Not seasonally adjusted.
Source: Texas Workforce Commission
Key Manufacturing Industries
Food manufacturing is the region’s largest manufacturing industry, with employment of more than 15,000 in 2019, comprising 48 percent of total regional manufacturing jobs. (Most of these jobs were in animal slaughtering and processing.) Other large industries include fabricated metal products (about 4,600 jobs) and machinery manufacturing (nearly 2,500 jobs).
High Plains Region manufacturing employment fell by 816 jobs or 2.5 percent between 2009 and 2019. Despite employment gains in recent years, food manufacturing incurred the largest losses during the 10-year period, down by 793 jobs or 5 percent. Textile mills lost nearly 500 jobs – the entirety of the regional industry. Chemical manufacturing [North American Industry Classification System (NAICS) codes 3251-3253] led job growth, adding 545 jobs in this period, a 46 percent gain. Employment in plastics and rubber products rose by nearly 300 jobs, a 45 percent gain.
The interactive Exhibit 8 displays regional manufacturing industry strengths and weaknesses through the use of two common analytical tools that compare regional manufacturing employment trends to national averages. These tools serve as an educational resource to inform development prospects and assess industry strengths beyond simple measures of employment change.
First, the location quotient (LQ) measures state and regional industry concentration levels by comparing an industry’s share of total regional employment to its share of total national employment. If the regional industry share exceeds the national share (an LQ greater than 1.00), the industry is more “concentrated” in the region than nationally. A score above 1.00 may indicate that the regional industry is strong and self-sufficient and that it exports its products or services beyond the region. Regional industries with below-average employment concentrations (LQs of less than 1.00) often import goods or services from other areas.
A second tool, shift-share analysis (SSA), measures regional industry job changes and assesses the role of local competitiveness on industry job gains or losses. The SSA uses national employment and industry trends to produce expected employment changes for a regional industry. If a regional industry’s actual employment changes exceed expected changes (a positive local competitiveness effect), the region may have a productive advantage in the industry. Conversely, a negative competitiveness effect indicates that the industry fell short of expected employment changes. Between 2009 and 2019, SSA shows that manufacturing employment in the High Plains Region missed expected changes by about 1,300 jobs.
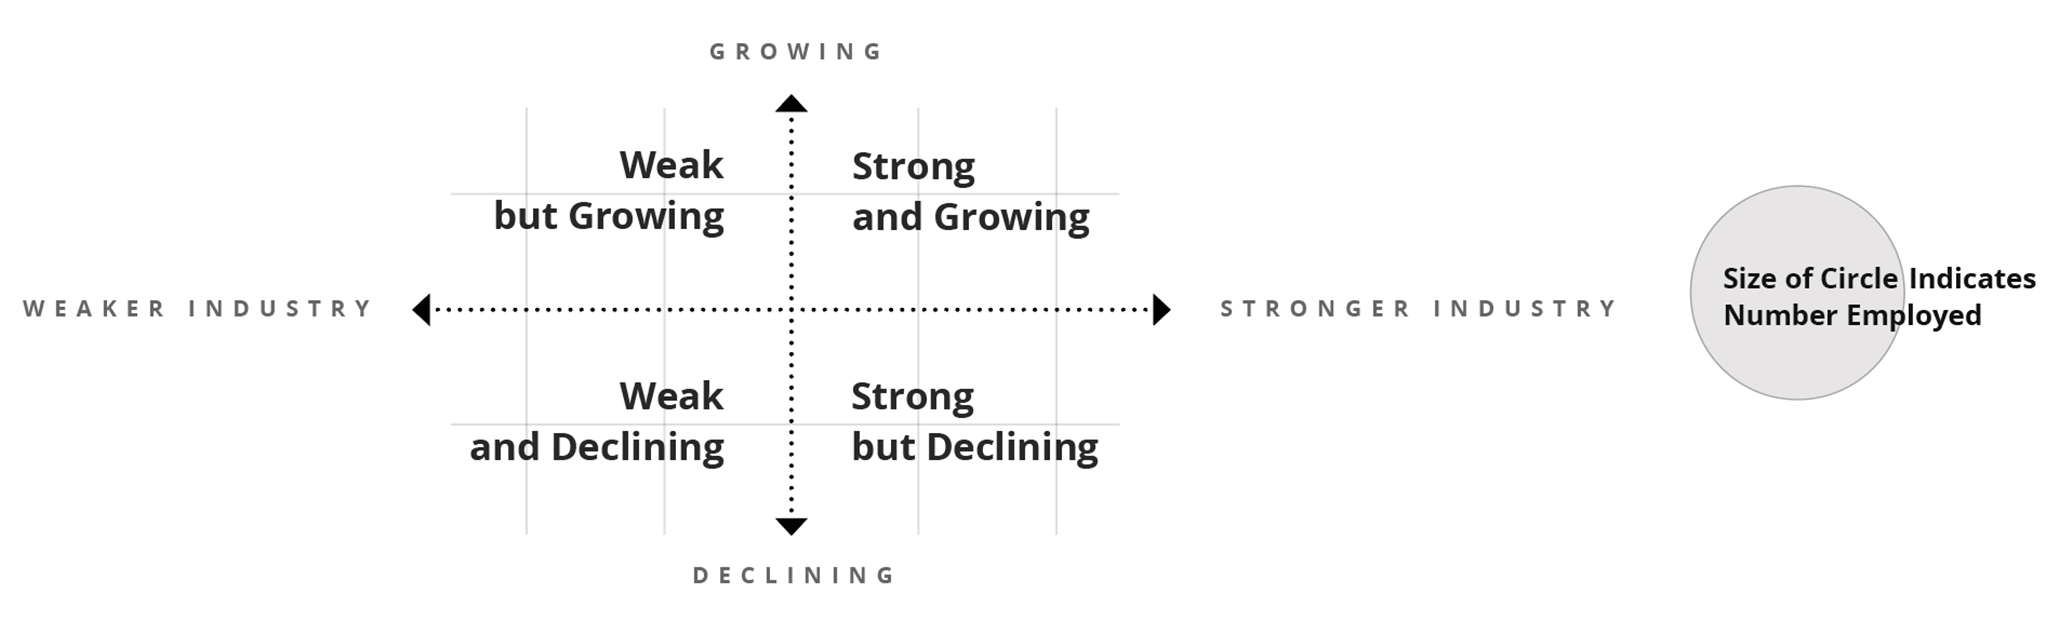
The High Plains Region’s manufacturing industries plotted in the exhibit fall into one of four quadrants based on 2019 LQ values and SSA values between 2009 and 2019:
- Strong and growing: Industry has above-average concentration levels (2019 LQ value > 1.00) and industry job changes exceeded expected changes between 2009 and 2019 (positive competitiveness effect);
- Strong but declining: Industry has above-average concentration levels (2019 LQ value > 1.00) and industry job changes fell below expected changes between 2009 and 2019 (negative competitiveness effect);
- Weak but growing: Industry has below-average concentration levels (2019 LQ value < 1.00) and industry job changes exceeded expected changes between 2009 and 2019 (positive competitiveness effect); and
- Weak and declining: Industry has below-average concentration levels (2019 LQ value < 1.00) and industry job changes fell below expected changes between 2009 and 2019 (negative competitiveness effect).
In 2019, food manufacturing was one of the region’s most heavily concentrated industries, with an LQ value of 3.58. (In other words, the industry’s share of High Plains Region employment is about 3.6 times as high as the industry’s nationwide share.) SSA measurements between 2009 and 2019, however, indicate that the industry fell short of expected employment by 970 jobs.
Energy-related industries – specifically petroleum products manufacturing and chemical manufacturing (NAICS codes 324 and 3251-3253) – also have an outsized presence in the region, with LQ values of 2.67 and 2.39, respectively. Employment in petroleum products fell slightly short of expected gains by 80 jobs. Chemical manufacturing greatly exceeded expected employment changes by 444 jobs. Fabricated metal products, also closely linked to energy production, maintains a strong presence in the region.
While small in total employment (338 jobs in 2019), the leather and allied products industry is the region’s most concentrated manufacturing industry compared to national averages. And the regional industry proved highly competitive, exceeding expected gains by 65 jobs between 2009 and 2019.
The levels of employment concentration for many of the region’s manufacturing industries remain below national averages, yet several show high levels of competitiveness, including plastics and rubber products, nonmetallic mineral products and aerospace and parts products manufacturing. Such developments could identify emerging industries and prospects for further growth.
A note of caution: A positive competitive effect indicates that some economic advantages exist in a region, such as access to natural resources or access to a more productive labor pool, management or technologies. A positive competitive effect indicates some economic advantages exist but cannot identify the source of that advantage.
Exhibit 8: Manufacturing Industries in the High Plains Region, Concentration Levels and Competitiveness
| Industry Title | NAICS | Employment, 2019 | Location Quotient, 2019 | Employment Changes due to Local Competitiveness, 2009-2019 |
|---|---|---|---|---|
| Food Manufacturing | 311 | 15,029 | 3.58 | -970 |
| Beverage and Tobacco Product Manufacturing | 312 | 256 | 0.35 | 50 |
| Textile Mills | 313 | 8 | 0.03 | -378 |
| Textile Product Mills | 314 | 216 | 0.75 | 13 |
| Apparel Manufacturing | 315 | 36 | 0.13 | 26 |
| Leather and Allied Product Manufacturing | 316 | 338 | 4.79 | 65 |
| Wood Product Manufacturing | 321 | 367 | 0.35 | -119 |
| Paper Manufacturing | 322 | 248 | 0.26 | 31 |
| Printing and Related Support Activities | 323 | 671 | 0.61 | -9 |
| Petroleum and Coal Products Manufacturing | 324 | 774 | 2.67 | -80 |
| Chemical Manufacturing (Resource-Intensive Commodities) | 3251-3253 | 1,731 | 2.39 | 444 |
| Pharmaceutical and Medicine Manufacturing | 3254 | 10 | 0.01 | -83 |
| Chemical Manufacturing (Locally Processed Goods) | 3255-3259 | 98 | 0.15 | -135 |
| Plastics and Rubber Products Manufacturing | 326 | 946 | 0.50 | 192 |
| Nonmetallic Mineral Product Manufacturing | 327 | 942 | 0.88 | 10 |
| Primary Metal Manufacturing | 331 | 414 | 0.42 | 5 |
| Fabricated Metal Product Manufacturing | 332 | 4,603 | 1.21 | -47 |
| Machinery Manufacturing | 333 | 2,479 | 0.86 | 15 |
| Computer and Electronic Product Manufacturing | 334 | 360 | 0.13 | -50 |
| Electrical Equipment, Appliance, and Component Manufacturing | 335 | 260 | 0.25 | -78 |
| Motor Vehicle, Body, and Parts Manufacturing | 3361-3363 | 115 | 0.04 | -90 |
| Aerospace Product and Parts Manufacturing | 3364 | 740 | 0.54 | 76 |
| Other Transportation Equipment Manufacturing | 3365-3369 | 30 | 0.05 | -19 |
| Furniture and Related Product Manufacturing | 337 | 253 | 0.26 | -11 |
| Medical Equipment and Supplies Manufacturing | 3391 | 116 | 0.14 | -35 |
| Other Miscellaneous Manufacturing | 3399 | 211 | 0.28 | -116 |
| Total - Manufacturing | 31,251 | 0.95 | -1,291 |
Sources: JobsEQ and Texas Comptroller of Public Accounts
Summary
Manufacturing employment in the High Plains Region fell by more than 2 percent between 2009 and 2019, lagging both the state and nation. Regional manufacturing is dominated by food manufacturing, while energy-related manufacturers of petroleum products, chemicals and fabricated metals maintain a strong regional presence.