Skip navigation

Top navigation skipped
Manufacturing in the Alamo Region
The 19-county Alamo Region in south central Texas stretches from Fredericksburg and Kerrville in the Hill Country to Port Lavaca on the Gulf Coast.
The region includes two metropolitan statistical areas (MSAs): the San Antonio-New Braunfels MSA, which includes Atascosa, Bandera, Bexar, Comal, Guadalupe, Kendall, Medina and Wilson counties, and the Victoria MSA, which includes Calhoun, Goliad and Victoria counties. Counties in the region not associated with an MSA include DeWitt, Frio, Gillespie, Gonzales, Jackson, Karnes, Kerr and Lavaca counties.
In 2019, the Alamo Region had an estimated population of about 2.9 million (9.9 percent of the state total) and accounted for approximately 9.2 percent of the state’s total employment.
The region included an estimated 62,503 manufacturing jobs in 2019, about 5.4 percent of its total employment of 1,157,671. The manufacturing sector’s regional gross domestic product (GDP) of $14.4 billion accounted for 9.2 percent of the total regional GDP of $156.4 billion. The Alamo Region’s manufacturers paid $4.1 billion in wages in 2019, about 6.8 percent of total regional wages of $59.4 billion. Annual wages for its manufacturing jobs averaged nearly $65,075 in 2019, 26.8 percent higher than the average wages of $51,313 for all regional jobs.
In Calhoun County, manufacturing played a particularly significant role, contributing 28.3 percent of the county’s total jobs, 67.8 percent of its total GDP, and 43.7 percent of its total wages, results far exceeding the regional averages. The county’s manufacturing jobs paid average wages of more than $107,000, also far exceeding the regional average (Exhibit 1).
Exhibit 1: Manufacturing Overview by County, Alamo Region, 2019
| County | Employment | Gross Domestic Product | Wages | ||||
|---|---|---|---|---|---|---|---|
| Total | Share | Total (millions) | Share | Total (millions) | Share | Average Annual Wages |
|
| Atascosa | 362 | 2.5% | $202 | 6.3% | $21 | 2.7% | $59,300 |
| Bandera | 20 | 0.6% | $5 | 1.2% | $1 | 1.1% | $65,168 |
| Bexar | 36,622 | 4.2% | $7,114 | 6.5% | $2,378 | 5.2% | $64,934 |
| Calhoun | 3,671 | 28.3% | $2,546 | 67.8% | $394 | 43.7% | $107,347 |
| Comal | 3,119 | 5.2% | $463 | 7.6% | $175 | 6.5% | $56,250 |
| DeWitt | 771 | 9.8% | $88 | 2.6% | $42 | 11.1% | $54,171 |
| Frio | 90 | 1.2% | $16 | 1.3% | $6 | 1.5% | $65,545 |
| Gillespie | 1,219 | 11.1% | $89 | 8.3% | $45 | 10.2% | $37,060 |
| Goliad | 19 | 1.4% | $3 | 0.8% | $1 | 2.2% | $65,311 |
| Gonzales | 1,098 | 14.9% | $110 | 3.8% | $52 | 16.1% | $47,344 |
| Guadalupe | 8,098 | 19.5% | $2,292 | 37.7% | $486 | 25.4% | $59,971 |
| Jackson | 1,104 | 18.2% | (D) | (D) | $53 | 18.7% | $48,168 |
| Karnes | 335 | 5.0% | $79 | 1.2% | $26 | 6.6% | $78,840 |
| Kendall | 1,081 | 6.2% | $190 | 8.5% | $57 | 6.4% | $52,773 |
| Kerr | 1,188 | 6.3% | $182 | 9.0% | $70 | 8.6% | $58,712 |
| Lavaca | 997 | 17.9% | $293 | 23.6% | $54 | 22.8% | $53,931 |
| Medina | 120 | 1.2% | $11 | 1.0% | $4 | 1.0% | $31,870 |
| Victoria | 2,061 | 5.3% | $617 | 13.3% | $170 | 9.2% | $82,596 |
| Wilson | 528 | 5.9% | $87 | 8.1% | $31 | 8.4% | $58,995 |
| Alamo Region Total | 62,503 | 5.4% | $14,385 | 9.2% | $4,067 | 6.8% | $65,075 |
| Texas | 908,801 | 7.2% | $241,005 | 13.1% | $72,473 | 9.6% | $79,746 |
(D): data not shown to avoid disclosure of confidential information.
Sources: JobsEQ, U.S. Bureau of Economic Analysis and Texas Comptroller of Public Accounts
In 2019, most of the region’s manufacturing activity was centered in Bexar County (San Antonio), which accounted for 58.6 percent, 49.5 percent and 58.5 percent of the region’s manufacturing jobs, GDP and wages, respectively.
Manufacturing in the Alamo Region comprises a variety of industrial sectors, including these:
- Caterpillar (Seguin) makes industrial engines and electric power generator sets used in defense, agriculture, transportation, power generation, construction, oil and gas.
- Garrison Brothers Distillery (Hye), Texas’ first legal whiskey distillery, makes a “sweet mash” using 100 percent organic corn harvested from Texas farms in the Panhandle near Hereford, Dalhart and Muleshoe.
- Heartland Enterprises (Fredericksburg) manufactures shafts, rods and other highly engineered parts for the oil and gas, aerospace and other industries.
- Knight Aerospace (San Antonio) combines aerospace, military and medical technology to provide modules and pallets to expand the functionality of cargo aircraft.
- Navistar International Corp. (San Antonio) manufactures commercial trucks, diesel engines and both school and commercial buses.
Long-Term Regional Trends
Between 2001 and 2019, manufacturing employment in the Alamo Region fell by 8.9 percent or 6,072 jobs. Manufacturing’s share of total regional employment decreased from 8.1 percent to 5.4 percent in this period (Exhibit 2).
Exhibit 2: Manufacturing Employment and Manufacturing Share of Total Employment, 2001 to 2019, Alamo Region
| Year | Total Industry Jobs | Manufacturing Jobs | Manufacturing Share of Total Industry Jobs |
|---|---|---|---|
| 2001 | 844,051 | 68,575 | 8.1% |
| 2002 | 842,206 | 63,126 | 7.5% |
| 2003 | 843,570 | 60,959 | 7.2% |
| 2004 | 851,411 | 58,393 | 6.9% |
| 2005 | 873,872 | 58,419 | 6.7% |
| 2006 | 906,817 | 61,141 | 6.7% |
| 2007 | 929,588 | 62,107 | 6.7% |
| 2008 | 947,544 | 59,424 | 6.3% |
| 2009 | 927,456 | 54,635 | 5.9% |
| 2010 | 934,403 | 55,430 | 5.9% |
| 2011 | 951,308 | 57,280 | 6.0% |
| 2012 | 975,925 | 58,652 | 6.0% |
| 2013 | 1,004,389 | 57,706 | 5.7% |
| 2014 | 1,038,546 | 57,943 | 5.6% |
| 2015 | 1,070,670 | 58,718 | 5.5% |
| 2016 | 1,095,159 | 58,636 | 5.4% |
| 2017 | 1,115,873 | 59,437 | 5.3% |
| 2018 | 1,137,675 | 61,401 | 5.4% |
| 2019 | 1,157,671 | 62,503 | 5.4% |
Sources: JobsEQ and Texas Comptroller of Public Accounts
The region recovered some manufacturing jobs between 2009 and 2019, adding 7,868 jobs for a 14.4 percent increase. By comparison, Texas and U.S. manufacturing jobs rose by 8.0 percent and 8.2 percent, respectively (Exhibit 3).
Exhibit 3: Percentage Change in Manufacturing Jobs, 2009 to 2019 (Indexed to 2009)
| Year | Alamo Region Jobs | Alamo Region Percent Change | Texas Jobs | Texas Percent Change | USA Jobs | USA Percent Change |
|---|---|---|---|---|---|---|
| 2009 | 54,635 | 0.0% | 841,353 | 0.0% | 11,854,159 | 0.0% |
| 2010 | 55,430 | 1.5% | 814,265 | -3.2% | 11,532,264 | -2.7% |
| 2011 | 57,280 | 4.8% | 840,195 | -0.1% | 11,748,311 | -0.9% |
| 2012 | 58,652 | 7.4% | 867,771 | 3.1% | 11,950,974 | 0.8% |
| 2013 | 57,706 | 5.6% | 877,534 | 4.3% | 12,040,273 | 1.6% |
| 2014 | 57,943 | 6.1% | 890,468 | 5.8% | 12,202,119 | 2.9% |
| 2015 | 58,718 | 7.5% | 881,291 | 4.7% | 12,339,571 | 4.1% |
| 2016 | 58,636 | 7.3% | 848,235 | 0.8% | 12,345,948 | 4.1% |
| 2017 | 59,437 | 8.8% | 854,385 | 1.5% | 12,456,179 | 5.1% |
| 2018 | 61,401 | 12.4% | 882,339 | 4.9% | 12,696,998 | 7.1% |
| 2019 | 62,503 | 14.4% | 908,801 | 8.0% | 12,828,307 | 8.2% |
Sources: JobsEQ and Texas Comptroller of Public Accounts
Between 2009 and 2019, the Alamo Region added 80 manufacturing establishments, a 4.6 percent increase, compared to gains of 9.4 percent in Texas and 1.1 percent in the U.S. (Exhibit 4).
Exhibit 4: Total Manufacturing Establishments in Alamo Region, 2009 to 2019
| Year | Alamo Region (total) | Alamo Region | Texas | USA |
|---|---|---|---|---|
| 2009 | 1,747 | 0.0% | 0.0% | 0.0% |
| 2010 | 1,719 | -1.6% | -1.4% | -2.5% |
| 2011 | 1,686 | -3.5% | -1.6% | -4.0% |
| 2012 | 1,693 | -3.1% | -1.9% | -4.7% |
| 2013 | 1,691 | -3.2% | -2.0% | -4.7% |
| 2014 | 1,697 | -2.9% | -1.4% | -3.9% |
| 2015 | 1,723 | -1.4% | 0.4% | -3.0% |
| 2016 | 1,728 | -1.1% | 1.7% | -2.2% |
| 2017 | 1,775 | 1.6% | 3.8% | -1.3% |
| 2018 | 1,796 | 2.8% | 5.7% | 0.0% |
| 2019 | 1,827 | 4.6% | 9.4% | 1.1% |
Sources: JobsEQ and Texas Comptroller of Public Accounts
The Alamo Region’s manufacturing jobs paid average wages of $65,075 in 2019, less than the Texas and U.S. averages of $79,746 and $69,976, respectively. Between 2009 and 2019, however, the region’s average wages rose by 45.1 percent, versus 32.0 percent in Texas and 27.4 percent in the U.S. (Exhibit 5).
Exhibit 5: Average Wages in Manufacturing Jobs, 2009 to 2019
| Year | Alamo Region | Texas | USA |
|---|---|---|---|
| 2009 | $44,850 | $60,401 | $54,939 |
| 2010 | $46,136 | $63,310 | $57,595 |
| 2011 | $48,175 | $66,075 | $59,277 |
| 2012 | $50,481 | $68,491 | $60,553 |
| 2013 | $51,898 | $68,838 | $61,143 |
| 2014 | $54,798 | $71,171 | $63,024 |
| 2015 | $56,388 | $72,815 | $64,352 |
| 2016 | $57,960 | $73,125 | $64,922 |
| 2017 | $60,721 | $75,806 | $66,898 |
| 2018 | $63,105 | $77,647 | $68,585 |
| 2019 | $65,075 | $79,746 | $69,976 |
Sources: JobsEQ and Texas Comptroller of Public Accounts
The manufacturing sector’s GDP value for the Alamo Region rose by an inflation-adjusted 118.3 percent between 2009 and 2019, for an average annual increase of 8.1 percent. The sector’s average annual GDP changes in Texas and the U.S., by comparison, were 2.6 percent and 1.9 percent, respectively (Exhibit 6).
Exhibit 6: Percentage Change in Real Gross Domestic Product, Manufacturing, 2009 to 2019 (Indexed to 2009)
| Year | Alamo Region | Texas | USA |
|---|---|---|---|
| 2009 | 0.0% | 0.0% | 0.0% |
| 2010 | 13.3% | 10.8% | 5.4% |
| 2011 | 22.9% | 15.0% | 5.8% |
| 2012 | 22.4% | 10.9% | 5.1% |
| 2013 | 65.7% | 23.3% | 8.3% |
| 2014 | 64.8% | 11.3% | 10.2% |
| 2015 | 73.8% | 15.0% | 11.7% |
| 2016 | 64.3% | 11.7% | 10.9% |
| 2017 | 87.1% | 18.2% | 13.7% |
| 2018 | 108.1% | 24.4% | 18.5% |
| 2019 | 118.3% | 29.7% | 20.8% |
Note: Due to GDP data withheld to avoid disclosure of confidential information, the analysis excludes the Alamo Region counties of Goliad and Jackson.
Sources: U.S Bureau of Economic Analysis and Texas Comptroller of Public Accounts
Pandemic Effects
All Texas industry sectors have been affected by the pandemic to some degree, and manufacturing is no exception. Monthly jobs data show that manufacturing jobs in the Victoria metropolitan area fell by 100 (or 5.0 percent) in February 2021 compared to the previous year. The San Antonio-New Braunfels MSA, however, saw a slight gain of 0.6 percent, or about 300 manufacturing jobs. The Alamo Region fared better than Texas and the U.S., which had manufacturing job losses of -6.0 percent and -4.1 percent, respectively, during the same period (Exhibit 7).
Exhibit 7: Changes in Manufacturing Jobs, February 2020 to February 2021
| Metro Area | Manufacturing Jobs | Percent Change (Manufacturing) | Percent Change (Total Employment) |
|---|---|---|---|
| San Antonio-New Braunfels MSA | 300 | 0.6% | -3.3% |
| Victoria MSA | -100 | -5.0% | -6.7% |
| Texas | -54,200 | -6.0% | -4.6% |
| United States | -524,000 | -4.1% | -6.0% |
Source: Texas Workforce Commission
Note: Not seasonally adjusted
Key Manufacturing Industries
Manufacturing jobs in the Alamo Region rose by nearly 7,900, or 14.4 percent, between 2009 and 2019. Motor vehicle, body and parts manufacturing comprised the bulk of these gains, adding nearly 5,200 jobs (+110 percent). Other regional industry gains included machinery manufacturing (up 1,800 jobs, or 60 percent), nonmetallic mineral products (up 1,040 jobs, or 39 percent) and food manufacturing (up 913 jobs, or 10 percent). Employment in printing and related services incurred the heaviest losses, falling by 1,812 jobs, or 53 percent. The aerospace product and parts industry fell by about 800 jobs, or nearly 20 percent, during this period.
Two industries – food manufacturing and motor vehicle, body and parts manufacturing – accounted for nearly a third of the Alamo Region’s manufacturing jobs and total wages in 2019.
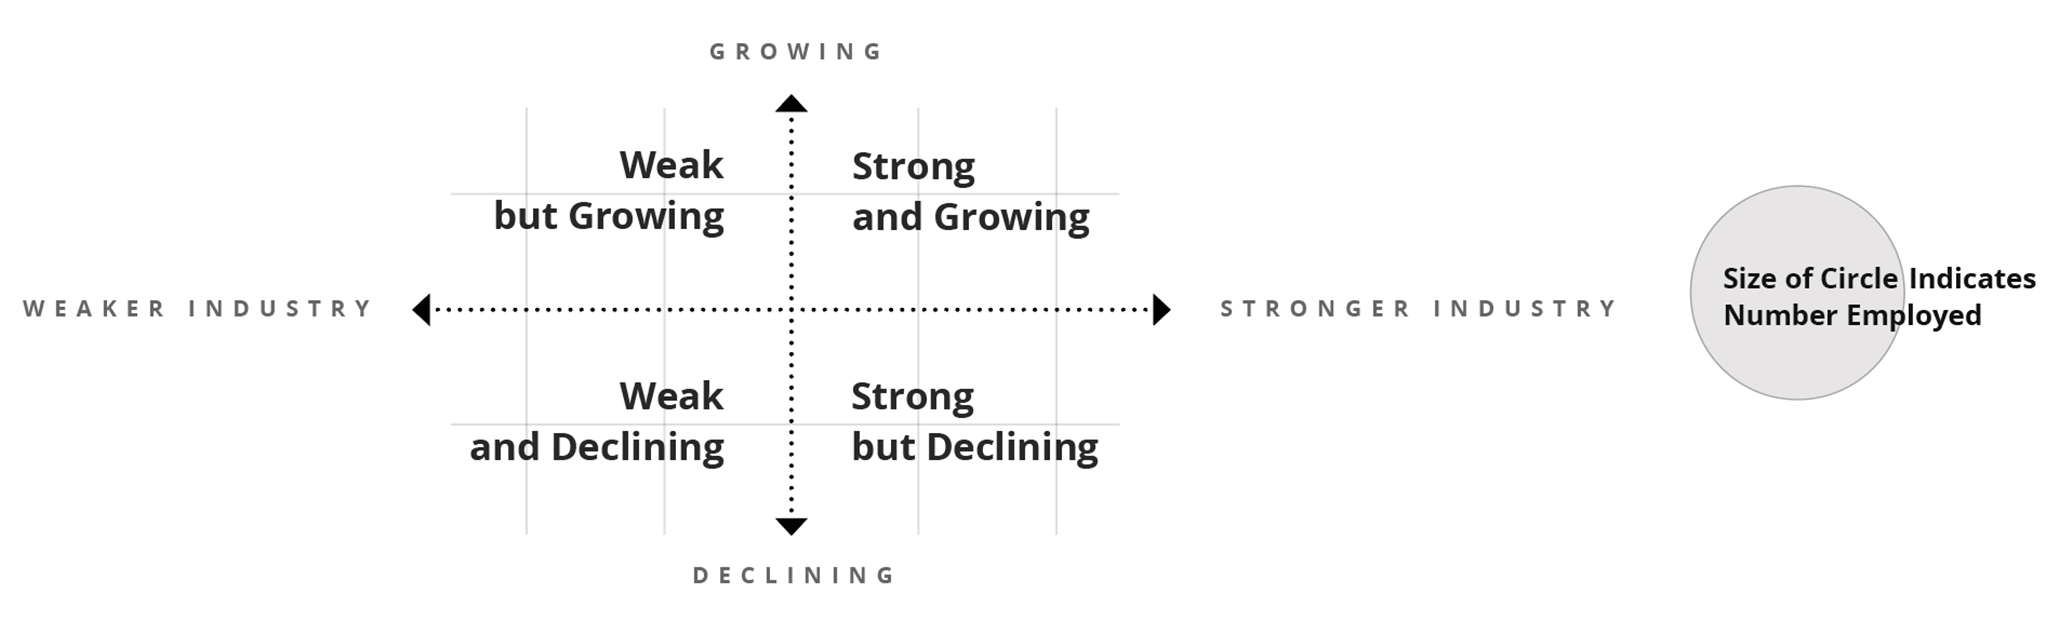
The interactive Exhibit 8 displays regional manufacturing industry strengths and weaknesses through the use of two common analytical tools that compare regional manufacturing employment trends to national averages. These tools serve as an educational resource to assess industry strengths and inform development prospects.
First, the location quotient (LQ) measures state and regional industry concentration levels by comparing an industry’s share of total regional employment to its share of total national employment. If the regional industry share exceeds the national share (an LQ greater than 1.00), the industry is more “concentrated” in the region than nationally. A score above 1.00 may indicate that the regional industry is strong and self-sufficient and that it exports its products or services beyond the region. Regional industries with below-average employment concentrations (LQs of less than 1.00) often import goods or services from other areas. The most heavily concentrated industries in the region are leather and allied products and chemical manufacturing, each with LQ values at nearly 2.0. (In other words, those industries’ shares of Alamo Region employment are nearly two times higher than the nationwide shares.)
A second tool, shift-share analysis (SSA), measures regional industry employment changes and assesses the role of local competitiveness on gains or losses. The SSA uses national employment and industry trends to produce expected employment changes for a regional industry. If a regional industry’s actual employment changes exceed expected changes (a positive local competitiveness effect), the region may have a productive advantage in the industry. Conversely, a negative competitiveness effect indicates that the industry fell short of expected employment changes. The manufacturing sector in the Alamo Region showed a positive competitive effect between 2009 and 2019, as sector employment exceeded expectations by more than 2,800 jobs.
The manufacturing industries plotted in the exhibit fall into one of four quadrants based on 2019 LQ values and SSA values between 2009 and 2019:
- Strong and growing: Industry has above-average concentration levels (2019 LQ value > 1.00) and industry job changes exceeded expected changes between 2009 and 2019 (positive competitiveness effect);
- Strong but declining: Industry has above-average concentration levels (2019 LQ value > 1.00) and industry job changes fell below expected changes between 2009 and 2019 (negative competitiveness effect);
- Weak but growing: Industry has below-average concentration levels (2019 LQ value < 1.00) and industry job changes exceeded expected changes between 2009 and 2019 (positive competitiveness effect); and
- Weak and declining: Industry has below-average concentration levels (2019 LQ value < 1.00) and industry job changes fell below expected changes between 2009 and 2019 (negative competitiveness effect).
The region capitalized on many of its strengths, as several strong regional industries surpassed employment expectations between 2009 and 2019. These include chemical manufacturing, beverage products, motor vehicles and parts, nonmetallic mineral products and other miscellaneous manufacturing. Regional employment in aerospace products and parts, however, fell short of employment expectations by more than 1,000 jobs.
Employment concentrations for many of the region’s other manufacturing industries remain below national averages, yet several showed high degrees of competitiveness, including computer and electronic products, medical equipment and supplies, machinery manufacturing and wood products. The machinery manufacturing industry was one of the region’s most competitive, as employment exceeded expected gains by 1,557 jobs. Such developments could identify emerging industries and prospects for further industrial growth.
A note of caution: A positive competitive effect indicates that some economic advantages exist in a region, such as access to natural resources or to a more productive labor pool, management or technologies. The sources of those advantages, however, cannot be identified through SSA.
Exhibit 8: Manufacturing Industries in the Alamo Region, Concentration Levels and Competitiveness
| Industry Title | NAICS | Employment, 2019 | Location Quotient, 2019 | Employment Changes due to Local Competitiveness, 2009-2019 |
|---|---|---|---|---|
| Food Manufacturing | 311 | 10,072 | 0.78 | -249 |
| Beverage and Tobacco Product Manufacturing | 312 | 2,403 | 1.05 | 142 |
| Textile Mills | 313 | 552 | 0.64 | 137 |
| Textile Product Mills | 314 | 287 | 0.32 | -513 |
| Apparel Manufacturing | 315 | 278 | 0.32 | 124 |
| Leather and Allied Product Manufacturing | 316 | 388 | 1.78 | -74 |
| Wood Product Manufacturing | 321 | 1,908 | 0.59 | 505 |
| Paper Manufacturing | 322 | 497 | 0.17 | -130 |
| Printing and Related Support Activities | 323 | 1,621 | 0.48 | -1,344 |
| Petroleum and Coal Products Manufacturing | 324 | 450 | 0.50 | 212 |
| Chemical Manufacturing (Resource-Intensive Commodities) | 3251-3253 | 3,903 | 1.74 | 396 |
| Pharmaceutical and Medicine Manufacturing | 3254 | 1,036 | 0.43 | -105 |
| Chemical Manufacturing (Locally Processed Goods) | 3255-3259 | 452 | 0.22 | -37 |
| Plastics and Rubber Products Manufacturing | 326 | 2,762 | 0.48 | -559 |
| Nonmetallic Mineral Product Manufacturing | 327 | 3,732 | 1.13 | 835 |
| Primary Metal Manufacturing | 331 | 1,202 | 0.39 | -492 |
| Fabricated Metal Product Manufacturing | 332 | 4,407 | 0.37 | -1,316 |
| Machinery Manufacturing | 333 | 4,789 | 0.54 | 1,557 |
| Computer and Electronic Product Manufacturing | 334 | 2,258 | 0.27 | 1,063 |
| Electrical Equipment, Appliance, and Component Manufacturing | 335 | 833 | 0.26 | 220 |
| Motor Vehicle, Body, and Parts Manufacturing | 3361-3363 | 9,907 | 1.25 | 3,054 |
| Aerospace Product and Parts Manufacturing | 3364 | 3,320 | 0.78 | -1,064 |
| Other Transportation Equipment Manufacturing | 3365-3369 | 111 | 0.06 | -60 |
| Furniture and Related Product Manufacturing | 337 | 1,343 | 0.44 | -649 |
| Medical Equipment and Supplies Manufacturing | 3391 | 1,363 | 0.53 | 273 |
| Other Miscellaneous Manufacturing | 3399 | 2,628 | 1.14 | 879 |
| Total - Manufacturing | 62,503 | 0.61 | 2,807 |
Sources: JobsEQ and Texas Comptroller of Public Accounts
Summary
The Alamo Region is a microcosm of the state, both urban and rural, with a vibrant and diverse economy. Bexar County, with the city of San Antonio at its center, is the region’s economic hub.
Over the past decade, manufacturing job growth in the Alamo Region has outpaced that of both the state and the U.S. It benefits from a variety of robust manufacturing industries that have helped it withstand both the Great Recession and the COVID-19 pandemic, and the region’s economy continues to thrive.