Skip navigation

Top navigation skipped
Texas Regional Manufacturing Overview
Introduction
Texas has an extraordinary manufacturing economy. The state’s resources make it a natural leader in petroleum and chemical manufacturing; its research institutions have fostered computer-related and other high-tech manufacturing; and a business-friendly environment and skilled labor have helped create a burgeoning automotive manufacturing sector.
Manufacturing directly employed about 909,000 Texans and contributed $241 billion to Texas’ gross domestic product (GDP) in 2019, about 13 percent of the state’s total economic output. To put Texas’ manufacturing sector in perspective, its economic output is larger than the manufacturing GDP in both Russia and Mexico, and it is larger than the entire economy of Portugal. Moreover, Texas manufacturing’s contribution to state GDP rose by 85 percent (after adjusting for inflation) between 2001 and 2019, outpacing total statewide GDP growth.
Manufacturing remains a key economic development magnet for communities. The sector stimulates employment in related sectors and services and remains a vital spark to innovation and economic development; many advanced manufacturing industries invest heavily in scientific and technological research and development (R&D). These characteristics of innovation and competition translate to high-paying jobs – average annual wages for all manufacturing jobs were more than $79,700 in 2019, compared to $59,800 for all Texas jobs.
Texas offers an attractive environment for manufacturing activity. The state has an extensive supply chain network of airports, seaports, interstate highways and railways; it is the U.S. leader in international exports of manufactured goods. The state’s abundant natural resources give it inherent strengths as a producer of energy-related products.
The exhibits below highlight overall trends in manufacturing and identify Texas’ industrial strengths. To provide further insights, these trends also are examined at the regional level since the composition of Texas manufacturing vary greatly by region.
COVID-19 Impact on Texas Manufacturing
As of February 2021, Texas’ seasonally adjusted total manufacturing jobs remained 53,900 (5.9 percent) below pre-COVID-19 levels in February 2020. Job losses were particularly hard on manufacturers of durable goods, such as fabricated metals and machinery equipment, which shed 46,500 jobs (8.0 percent) during this period. Jobs related to the production of non-durable goods, such as pharmaceuticals and food products, fell by 7,400 (2.3 percent). Total Texas jobs, by comparison, were down 4.6 percent during this period (Exhibit 1).
Exhibit 1: Percentage Change in Texas Manufacturing Jobs Since February 2020
| Month | All Industry Jobs | Total Manufacturing | Durable Goods Manufacturing | Non-Durable Goods Manufacturing | ||||
|---|---|---|---|---|---|---|---|---|
| Number | Percent | Number | Percent | Number | Percent | Number | Percent | |
| February | 0 | 0.0% | 0 | 0.0% | 0 | 0.0% | 0 | 0.0% |
| March | -64,000 | -2,300 | -1,600 | -700 | -0.5% | -0.3% | -0.3% | -0.2% |
| April | -1,452,600 | -55,000 | -34,200 | -20,800 | -11.2% | -6.0% | -5.9% | -6.4% |
| May | -1,213,300 | -53,400 | -38,700 | -14,700 | -9.4% | -5.9% | -6.6% | -4.5% |
| June | -999,900 | -50,500 | -37,800 | -12,700 | -7.7% | -5.5% | -6.5% | -3.9% |
| July | -976,500 | -59,900 | -44,700 | -15,200 | -7.5% | -6.6% | -7.7% | -4.6% |
| August | -890,700 | -59,300 | -45,600 | -13,700 | -6.9% | -6.5% | -7.8% | -4.2% |
| September | -824,200 | -58,100 | -45,600 | -12,500 | -6.4% | -6.4% | -7.8% | -3.8% |
| October | -721,400 | -54,600 | -43,300 | -11,300 | -5.6% | -6.0% | -7.4% | -3.5% |
| November | -670,500 | -54,800 | -45,100 | -9,700 | -5.2% | -6.0% | -7.7% | -3.0% |
| December | -604,800 | -52,000 | -45,200 | -6,800 | -4.7% | -5.7% | -7.8% | -2.1% |
| January | -565,800 | -51,300 | -43,900 | -7,400 | -4.4% | -5.6% | -7.5% | -2.3% |
| February | -593,300 | -53,900 | -46,500 | -7,400 | -4.6% | -5.9% | -8.0% | -2.3% |
Sources: Texas Workforce Commission and Texas Comptroller of Public Accounts
Note: Calculations reflect seasonally adjusted jobs.
Two manufacturing industries closely tied to the oil and gas sector suffered the heaviest job losses over the year ending February 2021: Fabricated metal products fell by 15.7 percent (14,500 jobs) and machinery manufacturing declined by 15.1 percent (20,600 jobs). These two industries accounted for nearly two-thirds of the 54,200 Texas manufacturing jobs lost over the year (detailed industry jobs are not seasonally adjusted, thus requiring year-over-year analysis).
Not all manufacturing industries lost jobs during this period. Food manufacturers added 3,500 jobs, a 3.5 percent rise. Other industry gainers included semiconductor component manufacturers (1,000 jobs) and pharmaceutical and medicine manufacturers (500 jobs) (Exhibit 2).
Exhibit 2: Largest Employment Gains and Losses by Manufacturing Industry in Texas, February 2020 to February 2021 (Percentage Change)
| Industry | Percent Change | Total Change |
|---|---|---|
| Largest Gains | ||
| Pharmaceutical and Medicine Manufacturing | 3.7% | 500 |
| Food Manufacturing | 3.5% | 3,500 |
| Semiconductor and Other Electronic Component Manufacturing | 2.4% | 1,000 |
| Motor Vehicle Manufacturing | 0.8% | 100 |
| Furniture and Related Product Manufacturing | 0.4% | 100 |
| Largest Losses | ||
| Electrical Equipment, Appliance, and Component Manufacturing | -5.9% | -1200 |
| Primary Metal Manufacturing | -8.9% | -1800 |
| Printing and Related Support Activities | -10.6% | -2600 |
| Machinery Manufacturing | -15.1% | -14500 |
| Fabricated Metal Product Manufacturing | -15.7% | -20600 |
Sources: Texas Workforce Commission and Texas Comptroller of Public Accounts
Note: Not seasonally adjusted
Local Area Changes
Among Texas’ metropolitan areas, only Tyler, Amarillo and San Antonio-New Braunfels saw year-over-year manufacturing employment gains in February 2021.
The downturn in oil markets greatly affected metro areas with manufacturing bases linked to the sector. The Odessa and Midland metro areas suffered the heaviest jobs losses by percentage, at 26.0 percent and 23.8 percent, respectively. The Houston metropolitan area had the most total losses at 29,300, comprising 54 percent of Texas’ 54,200 lost manufacturing jobs during this period (Exhibit 3).
Exhibit 3: Manufacturing Job Changes by Texas Metropolitan Area, February 2020 to February 2021 (Percentage Change)
| Metropolitan Area | Percent Change | Total Change |
|---|---|---|
| Tyler | 2.9% | 200 |
| Amarillo | 0.7% | 100 |
| San Antonio-New Braunfels | 0.6% | 300 |
| Abilene | 0.0% | 0 |
| Austin-Round Rock-Georgetown | -1.4% | -900 |
| Texarkana | -1.8% | -100 |
| Lubbock | -2.0% | -100 |
| Dallas-Fort Worth-Arlington | -3.2% | -9,300 |
| Sherman-Denison | -3.6% | -200 |
| Waco | -3.8% | -600 |
| Victoria | -5.0% | -100 |
| El Paso | -5.1% | -900 |
| Killeen-Temple | -5.1% | -400 |
| Texas | -6.0% | -54,200 |
| San Angelo | -6.1% | -200 |
| Longview | -6.3% | -600 |
| Brownsville-Harlingen | -6.5% | -400 |
| Bryan-College Station | -8.8% | -500 |
| Beaumont-Port Arthur | -8.9% | -1,900 |
| Corpus Christi | -9.3% | -800 |
| McAllen-Edinburg-Mission | -9.3% | -700 |
| Houston-The Woodlands-Sugar Land | -12.5% | -29,300 |
| Laredo | -12.5% | -100 |
| Wichita Falls | -13.5% | -700 |
| Midland | -23.8% | -1,000 |
| Odessa | -26.0% | -1,300 |
Sources: Texas Workforce Commission and Texas Comptroller of Public Accounts
Note: Not seasonally adjusted
Texas Manufacturing in the 21st Century
Texas manufacturing GDP growth outpaces national growth
Texas’ manufacturing inflation-adjusted GDP rose by 85 percent between 2001 and 2019, an average annual rate of 3.5 percent. Texas’ manufacturing growth outpaced the state’s total GDP growth of 72.7 percent, or 3.1 percent annually, during this period. The state’s manufacturing GDP nearly doubled U.S. manufacturing growth of 38 percent, or 1.8 percent annual growth (Exhibit 4).
Texas’ manufacturing sector experienced slower GDP growth between 2009 and 2019, rising by an annual average rate of 2.6 percent. The sector’s GDP in Texas did rise sharply between 2016 and 2019, after recovering from an economic slowdown caused by steep drops in energy prices in 2015 and 2016.
Exhibit 4: Percentage Change in Real Gross Domestic Product, 2001 to 2019
| Year | US Total GDP | US Manufacturing GDP | Texas Total GDP | Texas Manufacturing GDP |
|---|---|---|---|---|
| 2001 | 0.0% | 0.0% | 0.0% | 0.0% |
| 2002 | 1.7% | 0.9% | 2.0% | 2.6% |
| 2003 | 4.7% | 6.5% | 2.6% | 7.0% |
| 2004 | 8.6% | 14.0% | 8.1% | 38.8% |
| 2005 | 12.4% | 17.4% | 10.9% | 35.4% |
| 2006 | 15.7% | 24.1% | 18.3% | 53.4% |
| 2007 | 17.8% | 28.2% | 24.7% | 66.0% |
| 2008 | 17.7% | 25.6% | 24.8% | 51.4% |
| 2009 | 14.7% | 14.1% | 24.4% | 42.6% |
| 2010 | 17.6% | 20.2% | 27.4% | 58.1% |
| 2011 | 19.4% | 20.7% | 31.5% | 64.0% |
| 2012 | 22.1% | 19.9% | 38.1% | 58.1% |
| 2013 | 24.4% | 23.6% | 43.9% | 75.8% |
| 2014 | 27.5% | 25.7% | 48.6% | 58.7% |
| 2015 | 31.4% | 27.4% | 56.2% | 63.9% |
| 2016 | 33.7% | 26.4% | 57.2% | 59.4% |
| 2017 | 36.8% | 29.7% | 61.6% | 68.6% |
| 2018 | 40.9% | 35.2% | 67.9% | 77.4% |
| 2019 | 44.0% | 37.8% | 72.7% | 85.0% |
Sources: U.S. Bureau of Economic Analysis and Texas Comptroller of Public Accounts
Computers and transportation products lead manufacturing GDP growth
Texas’ high-tech and transportation industries led the manufacturing sector’s GDP growth over the last two decades. Texas’ computer and electronic products industry GDP rose by a staggering 544.1 percent between 2001 and 2019. Texas emerged as a major player in motor vehicle manufacturing during this period, with GDP expanding by 285.3 percent, greatly outpacing the industry’s U.S. growth. Texas’ chemical industry, aerospace and machinery manufacturing also largely outpaced industry growth nationwide.
Despite this growth, Texas lost more than 120,000 manufacturing jobs between 2001 and 2019, a 12 percent drop across all sectors. The nationwide job losses were even starker, falling by 3.6 million, a 22 percent decline. Manufacturing employment in the U.S. and Texas has diminished as a result of automation, offshoring, technological advancement, international trade and other factors. The divergence of employment and output is a testament to the productivity gains and innovation of the manufacturing sector.
Exhibit 5 details the largest GDP gains and losses among Texas’ manufacturing industries between 2001 and 2019 and the associated job changes. The computer and electronics products industry is a prime example of the divergence between manufacturing GDP and jobs. Even with the industry’s productivity gains in Texas during this period, its statewide employment fell by 41 percent.
Several manufacturing industries incurred heavy losses in both production and employment in Texas and the U.S., such as apparel production and textiles – industries that are highly vulnerable to trade and offshoring.
Exhibit 5: Top 5 Real GDP Percentage Gains and Declines by Manufacturing Industry in Texas, 2001-2019
| Industry | GDP Changes | Job Changes | ||
|---|---|---|---|---|
| Texas | U.S. | Texas | U.S. | |
| TOTAL MANUFACTURING | 85.0% | 37.8% | -12.0% | -22.0% |
| Largest GDP Gains | ||||
| Computer and electronic product manufacturing | 544.1% | 420.3% | -41.0% | -38.6% |
| Motor vehicles, bodies and trailers, and parts manufacturing | 285.3% | 61.0% | 27.9% | -17.3% |
| Chemical manufacturing | 151.9% | 12.8% | -0.4% | -11.1% |
| Other transportation equipment manufacturing, including aerospace | 151.2% | 53.8% | 7.8% | 3.0% |
| Machinery manufacturing | 64.4% | 15.9% | 12.1% | -17.7% |
| Largest GDP Losses | ||||
| Apparel, leather, and allied product manufacturing | -72.1% | -54.8% | -67.6% | -71.0% |
| Paper manufacturing | -30.9% | -13.6% | -32.3% | -36.8% |
| Printing and related support activities | -25.9% | -2.2% | -44.6% | -44.7% |
| Furniture and related product manufacturing | -19.8% | -24.7% | -29.6% | -40.0% |
| Textile mills and textile product mills | -10.9% | -41.4% | -46.8% | -59.9% |
Sources: U.S. Bureau of Economic Analysis, JobsEQ and Texas Comptroller of Public Accounts
Note: Industry classifications created by U.S. Bureau of Economic Analysis
Energy and high-tech dominate Texas manufacturing
Energy-related manufacturing industries are highly consequential to the state’s manufacturing base and have an outsize presence in Texas compared to the national averages. Texas’ petroleum and coal products manufacturers, for example, contributed $39.9 billion to state GDP in 2019, accounting for 26 percent of the industry’s total national economic value in 2019. The industry comprised 16.5 percent of Texas’ overall manufacturing output, much higher than the sector’s share nationwide of 6.7 percent.
Chemical manufacturing is a high-value industry nationwide, but its impact is even greater to the Texas manufacturing base. The industry contributed $56.9 billion to state GDP in 2019, the largest output value among its manufacturing industries, and comprised 23.6 percent of Texas’ total manufacturing output, much higher than its share nationally of 16.7 percent.
Computer and electronic products manufacturers also represent a greater share of the Texas manufacturing base than in the U.S. The Texas sector’s $36.8 billion in GDP was 15.3 percent of Texas manufacturing production, compared to 13 percent in the U.S. (Exhibit 6).
Exhibit 6: Top Manufacturing Industries in Texas by GDP, 2019
| Industry | Texas GDP (in millions) | Industry GDP Share Total Manufacturing Texas | U.S. GDP (in millions) | Industry GDP Share Total Manufacturing U.S. |
|---|---|---|---|---|
| Chemical manufacturing | $56,853 | 23.6% | $390,784 | 16.7% |
| Petroleum and coal products manufacturing | $39,869 | 16.5% | $158,066 | 6.7% |
| Computer and electronic product manufacturing | $36,793 | 15.3% | $303,924 | 13.0% |
| Motor vehicles, bodies and trailers and parts manufacturing | $16,337 | 6.8% | $164,006 | 7.0% |
| Machinery manufacturing | $15,344 | 6.4% | $162,609 | 6.9% |
| Other transportation equipment manufacturing (including aerospace) | $15,232 | 6.3% | $164,847 | 7.0% |
| Food and beverage and tobacco product manufacturing | $15,003 | 6.2% | $265,007 | 11.3% |
| Fabricated metal product manufacturing | $14,488 | 6.0% | $161,184 | 6.9% |
Sources: U.S. Bureau of Economic Analysis and Texas Comptroller of Public Accounts
Key Manufacturing Industries in Texas Common analysis tools can help identify strong and emerging industries
The Comptroller’s interactive exhibit reveals regional manufacturing industry strengths (and weaknesses) using two common economic analysis tools that compare state and regional manufacturing employment trends to national averages. These tools serve as an educational resource to assess industry strengths and inform development prospects.
First, the location quotient (LQ) analysis tool measures regional industry concentration levels by comparing an industry’s share of total regional employment to the industry’s share of total national employment. If the regional industry share exceeds the national industry share (an LQ greater than 1.00), then the industry is more concentrated in the region compared to the national average. A concentrated industry can (but doesn't always) indicate that the regional industry is strong and self-sufficient and that it exports its products or services outside of the region, bringing in dollars and resources from other areas. Conversely, regional industries with below-average employment concentrations (LQ less than 1.00) often import those goods or services from other areas. The petroleum products industry registered the highest LQ among the state’s manufacturing industries at 2.36 in 2019, meaning the industry share of total Texas jobs is 2.36 times greater than the national average.
A second tool, the shift-share analysis (SSA), measures regional industry job changes and assesses the role of local competitiveness on industry job gains or losses. The SSA uses both national employment trends and national industry trends to produce expected employment changes for a regional industry. If a regional industry’s actual employment changes exceed expected changes (a positive local competitiveness effect), then the region might have a productive advantage in the industry.
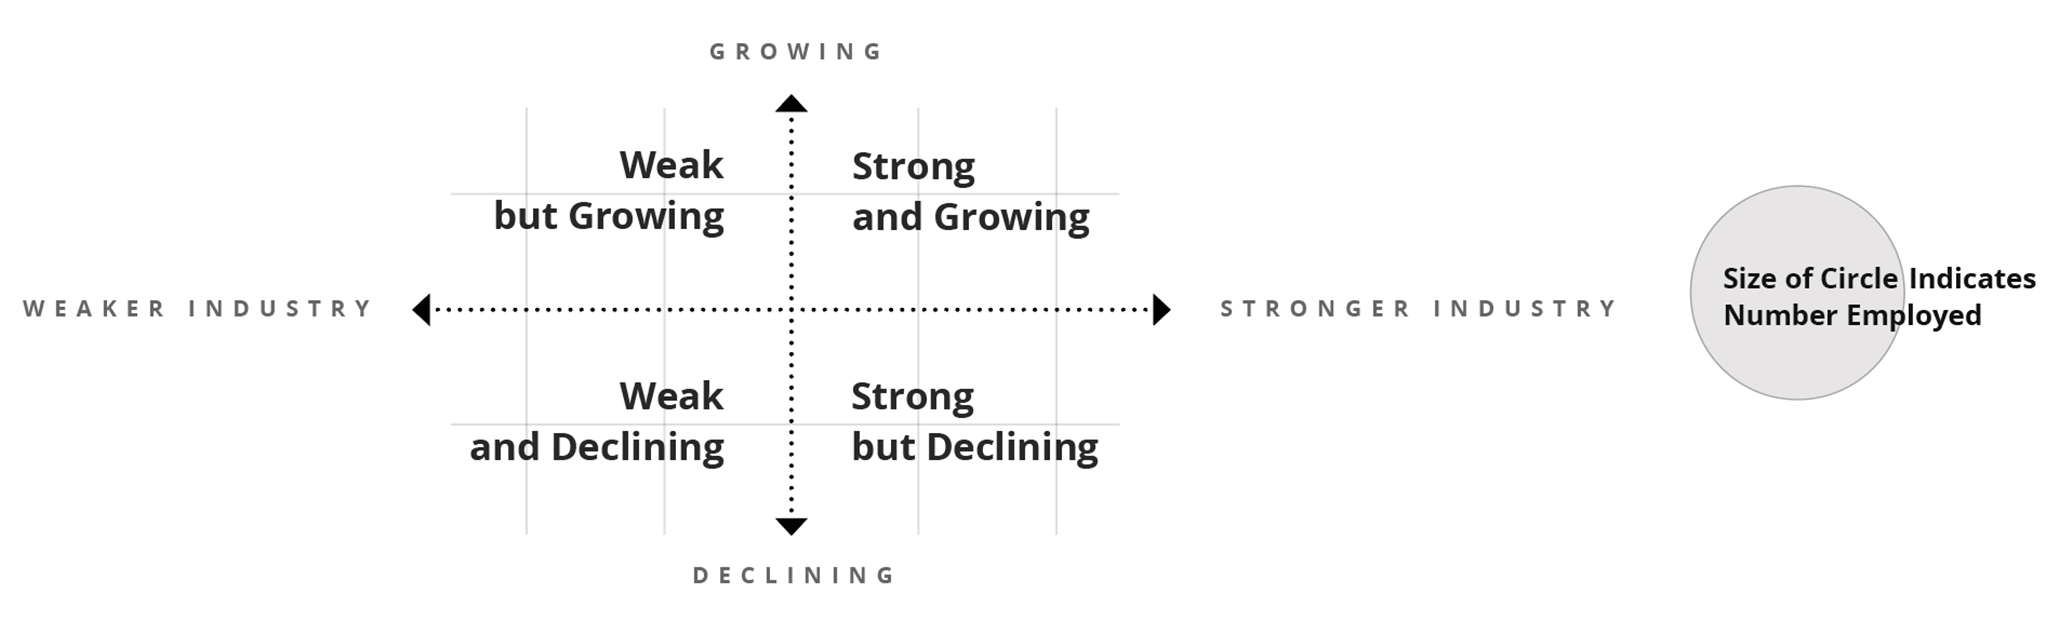
The state’s manufacturing industries are plotted in the interactive exhibit and fall into one of four quadrants based on 2019 LQ values and SSA between the years 2009 and 2019:
- Strong and growing: Industry has above-average concentration levels (2019 LQ value > 1.00) and industry job changes exceeded expected changes between 2009 and 2019 (positive competitiveness effect);
- Strong but declining: Industry has above-average concentration levels (2019 LQ value > 1.00) and industry job changes fell below expected changes between 2009 and 2019 (negative competitiveness effect);
- Weak but growing: Industry has below-average concentration levels (2019 LQ value < 1.00) and industry job changes exceeded expected changes between 2009 and 2019 (positive competitiveness effect); and
- Weak and declining: Industry has below-average concentration levels (2019 LQ value < 1.00) and industry job changes fell below expected changes between 2009 and 2019 (negative competitiveness effect).
While manufacturing is not highly concentrated in the state compared to national levels (2019 LQ = 0.82), the state does have competitive factors that allowed manufacturing jobs to flourish, as state manufacturing jobs exceeded expected changes by more than 6,500 jobs between 2009 and 2019.
Analysis of industry concentration levels and regional competitiveness could spark discussion among key economic development stakeholders. Questions one can consider: Why did job growth in Texas’ aerospace manufacturing industry fall short of expectations over the decade? Does the positive competitive effect in the advanced industry of pharmaceutical and medicine manufacturing present opportunities for more growth?
A note of caution: A positive competitive effect indicates that some economic advantages exist in the region, such as access to natural resources or access to a more productive labor pool, management or technologies. It cannot, however, identify the source of that advantage. That falls to the local economic development stakeholders and other experts.
This same interactive analysis is provided for Texas regions, helping to identify strong or emerging industries at local levels. This regional perspective is important, since the strength of many regional industries might be obscured at the statewide level. For example, motor vehicle manufacturing is not identified as a strong industry at the state level, but the industry is highly concentrated and strong in the Alamo and Metroplex regions. See the regional profiles to assess industry strength at the local level.
Exhibit 7: Manufacturing Industries in Texas, Concentration Levels and Competitiveness
| Industry Title | NAICS | Employment, 2019 | Location Quotient, 2019 | Employment Changes due to Local Competitiveness, 2009-2019 |
|---|---|---|---|---|
| Food Manufacturing | 311 | 99,232 | 0.71 | 1,943 |
| Beverage and Tobacco Product Manufacturing | 312 | 17,824 | 0.72 | 1,016 |
| Textile Mills | 313 | 1,875 | 0.20 | -435 |
| Textile Product Mills | 314 | 5,477 | 0.57 | -142 |
| Apparel Manufacturing | 315 | 5,672 | 0.61 | 2,198 |
| Leather and Allied Product Manufacturing | 316 | 4,459 | 1.89 | 845 |
| Wood Product Manufacturing | 321 | 24,973 | 0.71 | 548 |
| Paper Manufacturing | 322 | 18,024 | 0.57 | 1,019 |
| Printing and Related Support Activities | 323 | 24,547 | 0.67 | -18 |
| Petroleum and Coal Products Manufacturing | 324 | 22,974 | 2.36 | -613 |
| Chemical Manufacturing (Resource-Intensive Commodities) | 3251-3253 | 49,950 | 2.05 | 2,532 |
| Pharmaceutical and Medicine Manufacturing | 3254 | 13,013 | 0.49 | 2,632 |
| Chemical Manufacturing (Locally Processed Goods) | 3255-3259 | 20,465 | 0.91 | -28 |
| Plastics and Rubber Products Manufacturing | 326 | 40,761 | 0.65 | -4,273 |
| Nonmetallic Mineral Product Manufacturing | 327 | 38,069 | 1.06 | 232 |
| Primary Metal Manufacturing | 331 | 20,668 | 0.62 | 0 |
| Fabricated Metal Product Manufacturing | 332 | 132,500 | 1.04 | -1,806 |
| Machinery Manufacturing | 333 | 98,264 | 1.02 | 6,084 |
| Computer and Electronic Product Manufacturing | 334 | 93,148 | 1.01 | -806 |
| Electrical Equipment, Appliance, and Component Manufacturing | 335 | 20,179 | 0.59 | 1,090 |
| Motor Vehicle, Body, and Parts Manufacturing | 3361-3363 | 41,478 | 0.48 | -1,319 |
| Aerospace Product and Parts Manufacturing | 3364 | 52,252 | 1.13 | -3,177 |
| Other Transportation Equipment Manufacturing | 3365-3369 | 7,025 | 0.34 | -2,568 |
| Furniture and Related Product Manufacturing | 337 | 23,400 | 0.71 | -1,443 |
| Medical Equipment and Supplies | 3391 | 13,338 | 0.48 | 1,287 |
| Other Miscellaneous Manufacturing | 3399 | 19,234 | 0.77 | 1,769 |
| Total - Manufacturing | 908,801 | 0.82 | 6,565 |
Sources: JobsEQ and Texas Comptroller of Public Accounts
Manufacturing by Texas Regions Manufacturing characteristics and changes vary greatly by Texas regions
Regional analysis highlights how the scope and intensity of manufacturing varies widely across Texas regions, as shown in Exhibit 8. For example, manufacturing GDP accounted for 36.1 percent of total GDP in the Southeast region in 2019 and just over 4 percent in the West Texas region. Manufacturing as a share of total employment ranged from 3.6 percent in the South Texas region to nearly 13 percent in the Southeast region.
Average wages also differ greatly among regional manufacturing jobs, from about $49,100 in the Upper Rio Grande to nearly $107,000 in the Capital region.
Exhibit 8: Manufacturing Snapshot – Texas
| Area | Manufacturing Employment, 2019 | Share of Area's Total Employment, 2019 | Manufacturing GDP (in Billions), 2019 | Share of Area's Total GDP, 2019 | Average Wages, 2019 |
|---|---|---|---|---|---|
| U.S. | 12,828,307 | 8.7% | $2,346 | 10.9% | $69,976 |
| Texas | 908,801 | 7.2% | $241 | 13.1% | $79,746 |
| Alamo Region | 62,503 | 5.4% | $14.4 | 9.2% | $65,075 |
| Capital Region | 65,043 | 5.9% | $18.9 | 11.5% | $106,581 |
| Central Texas Region | 36,388 | 8.2% | $5.8 | 10.1% | $57,955 |
| Gulf Coast Region | 239,148 | 7.7% | $86.5 | 16.6% | $89,355 |
| High Plains Region | 31,251 | 8.4% | $8.6 | 17.3% | $60,614 |
| Metroplex Region | 301,827 | 8.1% | $65.5 | 12.1% | $81,759 |
| Northwest Region | 17,668 | 8.5% | $2.4 | 9.8% | $53,866 |
| South Texas Region | 29,893 | 3.6% | $7.1 | 8.3% | $60,987 |
| Southeast Region | 34,110 | 12.8% | $14.0 | 36.1% | $86,613 |
| Upper East Region | 50,748 | 11.9% | $8.6 | 17.0% | $54,135 |
| Upper Rio Grande Region | 17,010 | 5.3% | $2.8 | 8.2% | $49,074 |
| West Texas Region | 15,008 | 4.8% | $3.4 | 4.1% | $71,472 |
Sources: JobsEQ, U.S. Bureau of Economic Analysis and Texas Comptroller of Public Accounts
Manufacturing job changes also vary widely by Texas region, largely depending on the type of manufacturing dominant in the region. Manufacturing jobs fell most sharply in the Upper Rio Grande region, declining by an average annual rate of 3.2 percent from 2001 to 2019, with the region losing more than half of its manufacturing base. Manufacturing jobs in the Gulf Coast region were about even during this period, albeit with volatile swings in employment and a vulnerability to energy prices.
From 2009 through 2019, Texas and the U.S. slowly regained manufacturing jobs. The increase in both the state and nation was more than 8 percent, but this was not enough to replace the heavy losses incurred during the 2000s.
Use the interactive chart to explore total manufacturing job changes by Texas region (Exhibit 9).
Exhibit 9: Annual Percent Change in Manufacturing Employment
| Area | Total
2001-2019 |
2001-2008 | 2009-2019 |
|---|---|---|---|
| U.S. | -1.4% | -4.0% | 0.8% |
| Texas | -0.7% | -2.5% | 0.8% |
| Alamo Region | -0.5% | -2.8% | 1.4% |
| Capital Region | -1.1% | -5.2% | 2.4% |
| Central Texas Region | -0.6% | -1.7% | 0.4% |
| Gulf Coast Region | 0.0% | -0.5% | 0.4% |
| High Plains Region | -0.1% | 0.0% | -0.3% |
| Metroplex Region | -0.9% | -3.2% | 0.9% |
| Northwest Region | -1.3% | -2.9% | 0.1% |
| Southeast Region | -2.1% | -3.8% | -0.6% |
| South Texas Region | -1.0% | -2.1% | -0.1% |
| Upper East Region | -0.8% | -2.8% | 0.9% |
| Upper Rio Grande Region | -3.9% | -8.3% | -0.2% |
| West Texas Region | 0.2% | -2.3% | 2.3% |
Sources: JobsEQ and Texas Comptroller of Public Accounts
Summary
Texas is a large and diverse state, with its many regions offering various inherent and unique strengths. Sometimes these strengths come from the land, such as natural resources that provide cheaper access to energy or river systems that lower transportation costs. Or advantages could come from a highly educated and skilled workforce that attracts innovative and advanced manufacturing industries.
The processes and inputs used to manufacture goods also are highly diverse – not surprising for a sector that encompasses products from textiles to aerospace parts to pipeline infrastructure. Key manufacturing inputs include labor costs, capital expenditures, fuel and electricity costs, freight costs, R&D spending and trade. The relative importance of these inputs greatly influences where operations take place and how vulnerable industries are to automation or offshoring.
Given the size and diversity of the Texas economy, analyzing manufacturing activity at the regional level provides much greater insight into manufacturing strengths. In many instances, regional strengths and industry clusters are dwarfed by the size of the Texas economy, obscuring the importance of manufacturing industries to regional economies. The data and charts in the regional profiles help identify key strengths and opportunities at the local level, as well as potential shortcomings and challenges.