Skip navigation

Top navigation skipped
Manufacturing in the Southeast Region
The 15-county Southeast Region covers about 12,800 square miles in easternmost Texas, stretching from the Gulf of Mexico to Nacogdoches and the Louisiana border.
The Southeast Region contains one metropolitan statistical area (MSA), the Beaumont-Port Arthur MSA, which comprises Hardin, Jefferson, Newton and Orange counties. The region also includes Angelina, Houston, Jasper, Nacogdoches, Polk, Sabine, San Augustine, San Jacinto, Shelby, Trinity and Tyler counties. Its economic center is the city of Beaumont in Jefferson County.
In 2019, the Southeast Region had an estimated population of about 780,000, nearly 3 percent of the state total and accounted for 2 percent of the state’s total employment.
The region included more than 34,000 manufacturing jobs in 2019, about 12.8 percent of its total employment of more than 267,000. The sector’s share of regional gross domestic product (GDP), however, was almost three times higher, in a testament to the region’s high-value manufacturing production. Manufacturing’s regional GDP of $14 billion accounted for 36.1 percent of the total regional GDP of $38.7 billion. The Southeast Region’s manufacturers paid nearly $3 billion in wages in 2019, or 22 percent of total regional wages of $13.4 billion. Annual wages for its manufacturing jobs averaged more than $86,600 in 2019, far higher than the average wages of about $50,200 for all regional jobs.
Jefferson and Orange counties rely particularly heavily on petrochemical manufacturing and energy-related industrial fabrication. Manufacturing’s share of GDP is almost 47 percent in Jefferson County and 43.7 percent in Orange County, with more than 38 percent of Orange County wages coming from the sector (Exhibit 1).
Beaumont-Port Arthur is the location of the world’s largest oil refinery, Motiva, and many petrochemical companies have a significant presence in the area, including ExxonMobil, Chemtrade, Arkema, BASF, Valero, Goodyear, Total Cray Valley, Jefferson Energy, Golden Pass LNG, Sunoco and OCI. Other important subsectors include sheet metal fabrication, architectural metals and other energy-related industrial manufacturing, as well as rail car maintenance.
Lamar University in Beaumont, one of the region’s two higher education institutions, is home to the Texas Manufacturing Assistance Center – Southeast (TMAC-SE). The center, which opened in 2019, conducts manufacturing process research and holds seminars to unite students with employers and train engineers and technicians in modern manufacturing techniques. TMAC-SE recently agreed to help improve efficiency at Beaumont’s Natgasoline methanol production facility, the largest such plant in the U.S.
Exhibit 1: Manufacturing Overview by County, Southeast Region, 2019
| County | Employment | Gross Domestic Product | Wages | ||||
|---|---|---|---|---|---|---|---|
| Total | Share | Total (millions) | Share | Total (millions) | Share | Average Annual Wages |
|
| Angelina | 2,886 | 8.2% | $420 | 11.8% | $164 | 11.3% | $56,704 |
| Hardin | 814 | 6.3% | (D) | (D) | $51 | 8.9% | $63,103 |
| Houston | 711 | 10.2% | $162 | 16.4% | $58 | 15.7% | $80,888 |
| Jasper | 1,242 | 13.0% | $223 | 20.6% | $111 | 27.4% | $89,372 |
| Jefferson | 16,569 | 13.5% | $10,653 | 46.7% | $1,756 | 24.6% | $105,963 |
| Nacogdoches | 2,847 | 12.7% | $371 | 14.1% | $129 | 14.7% | $45,379 |
| Newton | 54 | 4.3% | (D) | (D) | $2 | 3.5% | $31,507 |
| Orange | 4,763 | 20.8% | $1,769 | 43.7% | $476 | 38.1% | $99,890 |
| Polk | 1,250 | 10.8% | $135 | 10.4% | $74 | 15.5% | $59,014 |
| Sabine | 349 | 14.1% | (D) | (D) | $25 | 27.3% | $71,661 |
| San Augustine | 99 | 4.6% | (D) | (D) | $4 | 3.9% | $37,872 |
| San Jacinto | 89 | 4.1% | $12 | 3.3% | $6 | 7.6% | $66,808 |
| Shelby | 2,107 | 24.7% | $202 | 16.6% | $83 | 24.1% | $39,335 |
| Trinity | 176 | 7.8% | $20 | 7.8% | $10 | 12.4% | $54,866 |
| Tyler | 155 | 3.9% | $17 | 3.9% | $8 | 5.3% | $48,688 |
| Southeast Region Total | 34,110 | 12.8% | $13,985 | 36.1% | $2,954 | 22.0% | $86,613 |
| Texas | 908,801 | 7.2% | $241,005 | 13.1% | $72,473 | 9.6% | $79,746 |
(D): data not shown to avoid disclosure of confidential information.
Sources: JobsEQ, U.S. Bureau of Economic Analysis and Texas Comptroller of Public Accounts
Long-Term Regional Trends
Between 2001 and 2019, manufacturing employment in the Southeast Region fell by about 16 percent or 6,600 jobs. Manufacturing’s share of total regional employment fell from 15.5 percent to 12.8 percent in this period (Exhibit 2).
Exhibit 2: Manufacturing Employment and Manufacturing Share of Total Employment, 2001 to 2019, Southeast Region
| Year | Total Industry Jobs | Manufacturing Jobs | Manufacturing Share of Total Industry Jobs |
|---|---|---|---|
| 2001 | 262,429 | 40,753 | 15.5% |
| 2002 | 259,983 | 39,069 | 15.0% |
| 2003 | 259,725 | 38,001 | 14.6% |
| 2004 | 259,305 | 36,641 | 14.1% |
| 2005 | 257,922 | 36,612 | 14.2% |
| 2006 | 266,014 | 38,682 | 14.5% |
| 2007 | 270,119 | 40,272 | 14.9% |
| 2008 | 271,491 | 39,041 | 14.4% |
| 2009 | 262,363 | 34,334 | 13.1% |
| 2010 | 261,655 | 33,117 | 12.7% |
| 2011 | 263,739 | 34,565 | 13.1% |
| 2012 | 264,630 | 35,849 | 13.5% |
| 2013 | 261,098 | 34,808 | 13.3% |
| 2014 | 267,069 | 35,617 | 13.3% |
| 2015 | 268,196 | 35,819 | 13.4% |
| 2016 | 265,397 | 33,887 | 12.8% |
| 2017 | 264,168 | 33,523 | 12.7% |
| 2018 | 266,530 | 33,686 | 12.6% |
| 2019 | 267,310 | 34,110 | 12.8% |
Sources: JobsEQ and Texas Comptroller of Public Accounts
The manufacturing sector’s linkage with the energy industry subjects it to some short-term volatility. The effects of the 2015-2017 plunge in oil prices are obvious in Exhibit 3, with regional manufacturing employment seeing a much sharper decline than the state as a whole. Manufacturing jobs slowly increased between 2017 and 2019 but remained just below 2009 levels.
Exhibit 3: Percentage Change in Manufacturing Jobs, 2009 to 2019 (Indexed to 2009)
| Year | Southeast Region Jobs | Southeast Region Percent Change | Texas Jobs | Texas Percent Change | USA Jobs | USA Percent Change |
|---|---|---|---|---|---|---|
| 2009 | 34,334 | 0.0% | 841,353 | 0.0% | 11,854,159 | 0.0% |
| 2010 | 33,117 | -3.5% | 814,265 | -3.2% | 11,532,264 | -2.7% |
| 2011 | 34,565 | 0.7% | 840,195 | -0.1% | 11,748,311 | -0.9% |
| 2012 | 35,849 | 4.4% | 867,771 | 3.1% | 11,950,974 | 0.8% |
| 2013 | 34,808 | 1.4% | 877,534 | 4.3% | 12,040,273 | 1.6% |
| 2014 | 35,617 | 3.7% | 890,468 | 5.8% | 12,202,119 | 2.9% |
| 2015 | 35,819 | 4.3% | 881,291 | 4.7% | 12,339,571 | 4.1% |
| 2016 | 33,887 | -1.3% | 848,235 | 0.8% | 12,345,948 | 4.1% |
| 2017 | 33,523 | -2.4% | 854,385 | 1.5% | 12,456,179 | 5.1% |
| 2018 | 33,686 | -1.9% | 882,339 | 4.9% | 12,696,998 | 7.1% |
| 2019 | 34,110 | -0.7% | 908,801 | 8.0% | 12,828,307 | 8.2% |
Sources: JobsEQ and Texas Comptroller of Public Accounts
These job losses were echoed by stagnation in the region’s number of manufacturing establishments. Between 2009 and 2019, its number of establishments saw a slight dip and recovery but remained essentially flat, versus gains of 9 percent in Texas and 1 percent in the U.S. (Exhibit 4).
Exhibit 4: Total Manufacturing Establishments in Southeast Region, 2009 to 2019
| Year | Souteast Region (total) | Southeast Region | Texas | USA |
|---|---|---|---|---|
| 2009 | 678 | 0.0% | 0.0% | 0.0% |
| 2010 | 664 | -2.1% | -1.4% | -2.5% |
| 2011 | 653 | -3.7% | -1.6% | -4.0% |
| 2012 | 650 | -4.1% | -1.9% | -4.7% |
| 2013 | 643 | -5.2% | -2.0% | -4.7% |
| 2014 | 634 | -6.5% | -1.4% | -3.9% |
| 2015 | 632 | -6.8% | 0.4% | -3.0% |
| 2016 | 633 | -6.6% | 1.7% | -2.2% |
| 2017 | 639 | -5.8% | 3.8% | -1.3% |
| 2018 | 635 | -6.3% | 5.7% | 0.0% |
| 2019 | 664 | -2.1% | 9.4% | 1.1% |
Sources: JobsEQ and Texas Comptroller of Public Accounts
The region’s manufacturing jobs paid average wages of $86,613 in 2019, far exceeding the Texas and U.S. averages. Between 2009 and 2019, average wages rose by 38.4 percent, compared to increases of 32 percent in Texas and 27 percent in the U.S. (Exhibit 5).
Exhibit 5: Average Wages in Manufacturing Jobs, 2009 to 2019
| Year | Southeast Region | Texas | USA |
|---|---|---|---|
| 2009 | $62,568 | $60,401 | $54,939 |
| 2010 | $65,679 | $63,310 | $57,595 |
| 2011 | $69,272 | $66,075 | $59,277 |
| 2012 | $74,204 | $68,491 | $60,553 |
| 2013 | $72,214 | $68,838 | $61,143 |
| 2014 | $76,685 | $71,171 | $63,024 |
| 2015 | $80,047 | $72,815 | $64,352 |
| 2016 | $80,980 | $73,125 | $64,922 |
| 2017 | $84,979 | $75,806 | $66,898 |
| 2018 | $86,650 | $77,647 | $68,585 |
| 2019 | $86,613 | $79,746 | $69,976 |
Sources: JobsEQ and Texas Comptroller of Public Accounts
The manufacturing sector’s GDP contribution to the Southeast Region also reflects the volatility brought on by its connection with the energy industry. Petrochemical manufacturing is very sensitive to oil and gas prices, and the huge swings in GDP reflect the boom-and-bust cycle in the 2010s. Ultimately, Southeast manufacturing GDP rose by an inflation-adjusted 22.5 percent between 2009 and 2019, about in range with Texas and U.S. gains of 29.7 percent and 20.8 percent, respectively (Exhibit 6).
Exhibit 6: Percentage Change in Real Gross Domestic Product, Manufacturing, 2009 to 2019 (Indexed to 2009)
| Year | Southeast Region | Texas | USA |
|---|---|---|---|
| 2009 | 0.0% | 0.0% | 0.0% |
| 2010 | 33.8% | 10.8% | 5.4% |
| 2011 | 36.8% | 15.0% | 5.8% |
| 2012 | 38.6% | 10.9% | 5.1% |
| 2013 | 39.3% | 23.3% | 8.3% |
| 2014 | -4.5% | 11.3% | 10.2% |
| 2015 | -6.8% | 15.0% | 11.7% |
| 2016 | 6.3% | 11.7% | 10.9% |
| 2017 | 13.9% | 18.2% | 13.7% |
| 2018 | 24.3% | 24.4% | 18.5% |
| 2019 | 22.5% | 29.7% | 20.8% |
Note: Due to GDP data withheld to avoid disclosure of confidential information, the analysis excludes the Upper East region’s Hardin, Newton, Sabine, San Augustine and Trinity counties.
Sources: U.S Bureau of Economic Analysis and Texas Comptroller of Public Accounts
Pandemic Effects
All Texas industry sectors have been affected by the pandemic to some degree, and manufacturing is no exception. Beaumont-Port Arthur’s February 2021 manufacturing employment was 1,900 positions or 8.9 percent lower than in the same month of the previous year. This fall was considerably deeper than the year-over-year manufacturing job declines of Texas (-6.0 percent) and the U.S. (-4.1 percent), as shown in Exhibit 7. It’s important to note that, in addition to the pandemic, simultaneous supply and demand shocks to the oil and gas industry in early 2020 undoubtedly contributed to these losses.
Exhibit 7: Changes in Manufacturing Jobs, February 2020 to February 2021
| Metro Area | Manufacturing Jobs | Percent Change (Manufacturing) | Percent Change (Total Employment) |
|---|---|---|---|
| Beaumont-Port Arthur | -1,900 | -8.9% | -7.2% |
| Texas | -54,200 | -6.0% | -4.6% |
| United States | -524,000 | -4.1% | -6.0% |
Note: Not seasonally adjusted.
Source: Texas Workforce Commission
Key Manufacturing Industries
Southeast Region manufacturing employment fell by 224 jobs or 0.7 percent between 2009 and 2019. The largest losses occurred in primary metal manufacturing (down by 611 jobs or 43 percent), wood products (down by 415 jobs or 10 percent), fabricated metal products (down by 363 jobs or 6.6 percent) and food manufacturing (down by 350 jobs or 8 percent). Chemical manufacturing (NAICS 3251-3253) led job growth, adding about 1,350 jobs in this period, a 26 percent increase. Employment in machinery manufacturing rose by 465 jobs, a 20 percent increase.
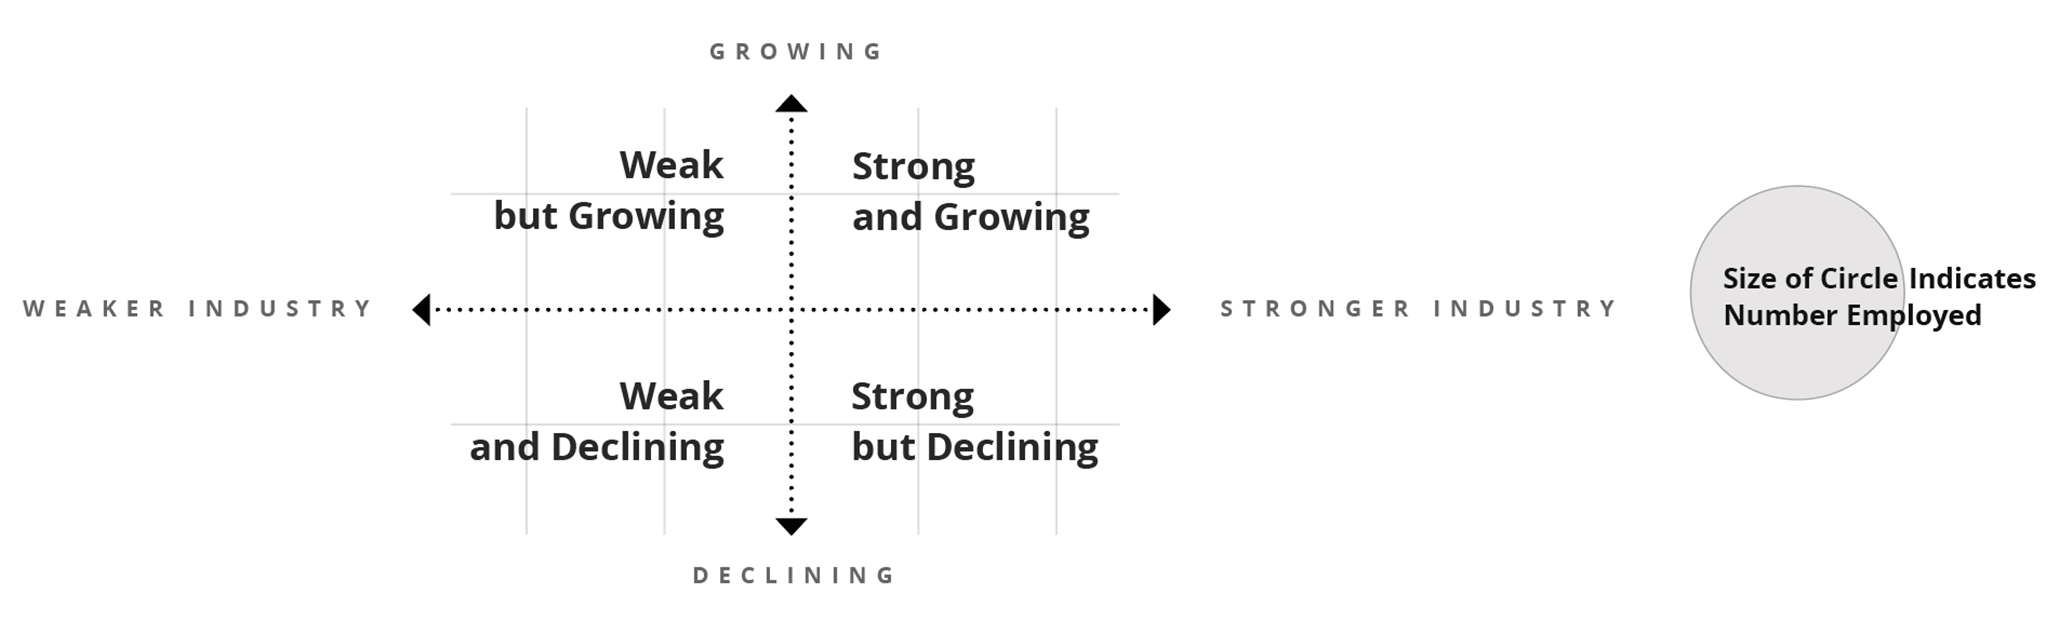
The interactive Exhibit 8 displays regional manufacturing industry strengths and weaknesses through the use of two common analytical tools that compare regional manufacturing employment trends to national averages. These tools serve as an educational resource to assess industry strengths and inform development prospects.
First, the location quotient (LQ) measures state and regional industry concentration levels by comparing an industry’s share of total regional employment to its share of total national employment. If the regional industry share exceeds the national share (an LQ greater than 1.00), the industry is more “concentrated” in the region than nationally. A score above 1.00 may indicate that the regional industry is strong and self-sufficient and that it exports its products or services beyond the region. Regional industries with below-average employment concentrations (LQs of less than 1.00) often import goods or services from other areas.
A second tool, shift-share analysis (SSA), measures regional industry job changes and assesses the role of local competitiveness on industry job gains or losses. The SSA uses national employment and industry trends to produce expected employment changes for a regional industry. If a regional industry’s actual employment changes exceed expected changes (a positive local competitiveness effect), the region may have a productive advantage in the industry. Conversely, a negative competitiveness effect indicates that the industry fell short of expected employment changes. Between 2009 and 2019, SSA shows that manufacturing employment in the Southeast Region fell below expected changes by more than 2,000 jobs.
The Southeast Region’s manufacturing industries plotted in the exhibit fall into one of four quadrants based on 2019 LQ values and SSA values between 2009 and 2019:
- Strong and growing: Industry has above-average concentration levels (2019 LQ value > 1.00) and industry job changes exceeded expected changes between 2009 and 2019 (positive competitiveness effect);
- Strong but declining: Industry has above-average concentration levels (2019 LQ value > 1.00) and industry job changes fell below expected changes between 2009 and 2019 (negative competitiveness effect);
- Weak but growing: Industry has below-average concentration levels (2019 LQ value < 1.00) and industry job changes exceeded expected changes between 2009 and 2019 (positive competitiveness effect); and
- Weak and declining: Industry has below-average concentration levels (2019 LQ value < 1.00) and industry job changes fell below expected changes between 2009 and 2019 (negative competitiveness effect).
A variety of manufacturing industries are heavily concentrated in the Southeast Region. Its petroleum and coal products manufacturing industry is the most heavily concentrated, with an LQ of 22.27. (In other words, the industry’s share of Southeast Region employment is more than 22 times higher than the industry’s nationwide share.) Despite oil and gas volatility between 2009 and 2019, this industry proved competitive in the region, with employment exceeding expected gains by 421 jobs. The heavily concentrated chemical manufacturing industry added almost 1,200 jobs more than expected between 2009 and 2019. This contrasts with the lackluster performance of these two industries in the neighboring Gulf Coast region during the same period.
Other strong regional industries, however, didn’t meet expected employment changes, according to SSA calculations for 2009 and 2019. The region’s fabricated metal manufacturing, closely linked to the energy sector, fell short of expected gains by 1,100 jobs. Wood product manufacturing and paper manufacturing, regional industry pillars with access to East Texas’ Piney Woods, fell short of expected gains by about 800 jobs and 100 jobs, respectively. Food manufacturing employment fell short by 775 jobs.
Employment concentrations for many of the region’s other manufacturing industries remain below national averages, yet some showed high degrees of competitiveness, including electrical equipment and appliance manufacturing. This industry exceeded expected gains by about 140 jobs. Such developments could identify emerging industries and prospects for further industrial growth.
A note of caution: A positive competitive effect indicates that some economic advantages exist in a region, such as access to natural resources or access to a more productive labor pool, management or technologies. A positive competitive effect indicates some economic advantages exist but cannot identify the source of that advantage.
Exhibit 8: Manufacturing Industries in the Southeast Region, Concentration Levels and Competitiveness
| Industry Title | NAICS | Employment, 2019 | Location Quotient, 2019 | Employment Changes due to Local Competitiveness, 2009-2019 |
|---|---|---|---|---|
| Food Manufacturing | 311 | 4,171 | 1.38 | -775 |
| Beverage and Tobacco Product Manufacturing | 312 | 243 | 0.46 | -62 |
| Textile Mills | 313 | 0 | 0.00 | -1 |
| Textile Product Mills | 314 | 132 | 0.63 | 62 |
| Apparel Manufacturing | 315 | 77 | 0.38 | 29 |
| Leather and Allied Product Manufacturing | 316 | 2 | 0.03 | -8 |
| Wood Product Manufacturing | 321 | 3,810 | 5.05 | -817 |
| Paper Manufacturing | 322 | 1,198 | 1.77 | -101 |
| Printing and Related Support Activities | 323 | 492 | 0.62 | 82 |
| Petroleum and Coal Products Manufacturing | 324 | 4,671 | 22.27 | 421 |
| Chemical Manufacturing (Resource-Intensive Commodities) | 3251-3253 | 6,494 | 12.39 | 1,178 |
| Pharmaceutical and Medicine Manufacturing | 3254 | 34 | 0.06 | 34 |
| Chemical Manufacturing (Locally Processed Goods) | 3255-3259 | 520 | 1.08 | 106 |
| Plastics and Rubber Products Manufacturing | 326 | 316 | 0.23 | -169 |
| Nonmetallic Mineral Product Manufacturing | 327 | 324 | 0.42 | -185 |
| Primary Metal Manufacturing | 331 | 820 | 1.14 | -606 |
| Fabricated Metal Product Manufacturing | 332 | 5,110 | 1.86 | -1,102 |
| Machinery Manufacturing | 333 | 2,730 | 1.31 | 264 |
| Computer and Electronic Product Manufacturing | 334 | 421 | 0.21 | -325 |
| Electrical Equipment, Appliance, and Component Manufacturing | 335 | 431 | 0.58 | 139 |
| Motor Vehicle, Body, and Parts Manufacturing | 3361-3363 | 229 | 0.12 | -48 |
| Aerospace Product and Parts Manufacturing | 3364 | 0 | 0.00 | 0 |
| Other Transportation Equipment Manufacturing | 3365-3369 | 1,054 | 2.37 | -210 |
| Furniture and Related Product Manufacturing | 337 | 291 | 0.41 | -47 |
| Medical Equipment and Supplies Manufacturing | 3391 | 82 | 0.14 | -39 |
| Other Miscellaneous Manufacturing | 3399 | 459 | 0.85 | 68 |
| Total - Manufacturing | 34,110 | 1.43 | -2,111 |
Sources: JobsEQ and Texas Comptroller of Public Accounts
Summary
Manufacturing is important to the Southeast Region, providing 12.8 percent of its jobs and $14 billion or 36.8 percent of its GDP. With average wages of $86,600 annually in 2019, these jobs pay significantly higher than the regional average.
The region’s sector is dominated by petroleum products and chemical production, which are subject to the volatility of the oil and gas industry. But even with the major oil and gas swings in the last decade (pre-COVID), manufacturing GDP still rose by 22.5 percent between 2009 and 2019. Chemical manufacturing did especially well, adding 1,350 jobs in this period. SSA calculations indicate that a large portion of these gains were due to the presence of unique competitive factors in the region.
Despite this growth, the region’s overall manufacturing employment fell slightly during this period. Other highly concentrated regional subsectors — metal product fabrication, wood product manufacturing and transportation manufacturing — saw steeper-than-expected job losses, suggesting reduced competitiveness during the past 10 years.