Skip navigation

Top navigation skipped
Manufacturing in the Gulf Coast Region
Texas’ Gulf Coast Region includes 13 counties surrounding the Houston area, including Galveston, and stretches from Huntsville to the north side of Matagorda Bay. The region is dominated by the Houston-The Woodlands-Sugar Land metropolitan statistical area (MSA), the nation’s fifth-largest MSA, which includes the counties of Austin, Brazoria, Chambers, Fort Bend, Galveston, Harris, Liberty, Montgomery and Waller. The region also includes Colorado, Matagorda, Walker and Wharton counties.
In 2019, the region’s population was estimated at more than 7 million, a quarter of the state population. This marked a 19 percent increase since the 2010 census, with Fort Bend and Montgomery counties showing particularly rapid growth of more than 30 percent.
About 3 million Gulf Coast residents were employed in 2019, 26 percent of the state’s total. This included more than 239,000 manufacturing jobs, 7.7 percent of the region’s total employment. The sector’s contribution to regional gross domestic product (GDP) and total wages was much larger, however, reflecting the region’s high-value manufacturing production. The manufacturing sector’s regional GDP of $86.5 billion accounted for 16.6 percent of the total regional GDP of $519.8 billion. The Gulf Coast Region’s manufacturers paid more than $21.4 billion in wages in 2019, more than 10 percent of the region’s total wages of $211.1 billion. Annual wages for its manufacturing jobs averaged more than $89,000 in 2019, versus about $68,000 for all regional jobs (Exhibit 1).
As the Gulf Coast’s economic center, Houston’s manufacturing GDP of $80 billion is second-largest among U.S. metros. The city boasts one of the nation’s largest manufacturing workforces. Sixty-five percent of Houston’s manufacturing jobs (5.5 percent of all Houston jobs) are related to durable goods such as oil field equipment, structural steel and computers.
According to a 2019 Economic Innovation Group report, Harris County saw the highest manufacturing job growth among all U.S. counties from 2016 to 2018, adding almost 11,600 jobs. Elsewhere in the region, Chambers County is the home of Mont Belvieu, one of the world’s largest petrochemical and industrial gas manufacturing sites. The county’s manufacturing sector was responsible for 31.6 percent of its wages and 38.3 percent of its GDP in 2019. Its manufacturing wages average more than $116,000. Mostly rural Waller County, meanwhile, is home to a cluster of oil and gas manufacturing companies that contributed 44.4 percent of that county’s GDP and 30.4 percent of its wages in 2019.
The region is home to a number of workforce development initiatives intended to expand its advanced manufacturing sector. Upskill Houston is an employer-led initiative that unites the Greater Houston Partnership, a business consortium, with educators to create more middle-skills jobs — including those in advanced manufacturing — and ensure that colleges teach the skills to fill them. The University of Houston’s Advanced Manufacturing Institute (AMI) helps bring manufacturing technology research to market, focusing on semiconductors and superconductors, electronics and chemical and battery manufacturing. And Houston Community College’s Advanced Manufacturing Center of Excellence, founded in 2016, trains students for high-quality jobs in machining, CNC operations, robotics and other advanced manufacturing industries.
Exhibit 1: Manufacturing Overview by County, Gulf Coast Region, 2019
| County | Employment | Gross Domestic Product | Wages | ||||
|---|---|---|---|---|---|---|---|
| Total | Share | Total (millions) | Share | Total (millions) | Share | Average Annual Wages |
|
| Austin | 1,406 | 13.2% | $274 | 18.6% | $86 | 16.3% | $61,220 |
| Brazoria | 13,121 | 11.3% | $5,444 | 32.2% | $1,490 | 21.8% | $113,582 |
| Chambers | 3,191 | 18.5% | $1,185 | 38.3% | $371 | 31.6% | $116,285 |
| Colorado | 1,173 | 16.8% | $151 | 17.5% | $68 | 22.0% | $58,152 |
| Fort Bend | 14,368 | 7.3% | $4,991 | 18.6% | $1,135 | 11.0% | $78,962 |
| Galveston | 5,943 | 5.3% | $4,610 | 28.2% | $698 | 12.2% | $117,506 |
| Harris | 180,452 | 7.7% | $60,243 | 14.6% | $16,144 | 9.4% | $89,466 |
| Liberty | 1,352 | 7.3% | $213 | 9.7% | $100 | 11.2% | $73,938 |
| Matagorda | 492 | 4.6% | $32 | 1.4% | $42 | 6.9% | $85,678 |
| Montgomery | 10,938 | 5.7% | $7,836 | 26.0% | $834 | 7.4% | $76,226 |
| Walker | 1,230 | 4.9% | $175 | 7.4% | $69 | 6.6% | $56,444 |
| Waller | 4,023 | 21.3% | $1,173 | 44.4% | $266 | 30.4% | $66,139 |
| Wharton | 1,459 | 8.9% | $155 | 7.8% | $65 | 9.5% | $44,485 |
| Gulf Coast Region Total | 239,148 | 7.7% | $86,482 | 16.6% | $21,369 | 10.1% | $89,355 |
| Texas | 908,801 | 7.2% | $241,005 | 13.1% | $72,473 | 9.6% | $79,746 |
Sources: JobsEQ, U.S. Bureau of Economic Analysis and Texas Comptroller of Public Accounts
Long-Term Regional Trends
Much of the Gulf Coast Region’s manufacturing is linked to the oil and gas sector and has seen stable but flat employment in the past two decades, with an almost equal number of jobs in 2001 and 2019. As the region’s workforce grew considerably during that period, manufacturing’s share of total jobs fell from 10.4 to 7.7 percent. The manufacturing sector’s linkage with the energy industry subjects it to some short-term volatility, with employment decreasing considerably during and after the oil price downturn beginning in 2015, for instance (Exhibit 2).
Exhibit 2: Manufacturing Employment and Manufacturing Share of Total Employment, 2001 to 2019, Gulf Coast Region
| Year | Total Industry Jobs | Manufacturing Jobs | Manufacturing Share of Total Industry Jobs |
|---|---|---|---|
| 2001 | 355,420 | 40,239 | 11.3% |
| 2002 | 357,119 | 38,371 | 10.7% |
| 2003 | 356,737 | 36,124 | 10.1% |
| 2004 | 363,154 | 36,598 | 10.1% |
| 2005 | 374,150 | 39,477 | 10.6% |
| 2006 | 380,959 | 39,920 | 10.5% |
| 2007 | 384,898 | 39,813 | 10.3% |
| 2008 | 393,763 | 39,025 | 9.9% |
| 2009 | 389,628 | 35,065 | 9.0% |
| 2010 | 392,697 | 34,510 | 8.8% |
| 2011 | 393,798 | 34,716 | 8.8% |
| 2012 | 398,296 | 36,449 | 9.2% |
| 2013 | 406,472 | 36,520 | 9.0% |
| 2014 | 415,040 | 37,343 | 9.0% |
| 2015 | 423,721 | 37,318 | 8.8% |
| 2016 | 427,984 | 36,216 | 8.5% |
| 2017 | 434,481 | 36,856 | 8.5% |
| 2018 | 438,745 | 37,631 | 8.6% |
| 2019 | 444,770 | 36,388 | 8.2% |
Sources: JobsEQ and Texas Comptroller of Public Accounts
The effects of that 2015-2017 plunge in oil prices are even more obvious in Exhibit 3. The region’s manufacturing job count saw a much sharper decline than the state as a whole. By 2019, however, manufacturing jobs were back up, gaining 4.5 percent above 2009 levels.
Exhibit 3: Percentage Change in Manufacturing Jobs, 2009 to 2019 (Indexed to 2009)
| Year | Gulf Coast Region Jobs | Gulf Coast Region Percent Change | Texas Jobs | Texas Percent Change | USA Jobs | USA Percent Change |
|---|---|---|---|---|---|---|
| 2009 | 228,921 | 0.0% | 841,353 | 0.0% | 11,854,159 | 0.0% |
| 2010 | 220,799 | -3.5% | 814,265 | -3.2% | 11,532,264 | -2.7% |
| 2011 | 231,386 | 1.1% | 840,195 | -0.1% | 11,748,311 | -0.9% |
| 2012 | 247,283 | 8.0% | 867,771 | 3.1% | 11,950,974 | 0.8% |
| 2013 | 255,900 | 11.8% | 877,534 | 4.3% | 12,040,273 | 1.6% |
| 2014 | 259,047 | 13.2% | 890,468 | 5.8% | 12,202,119 | 2.9% |
| 2015 | 249,217 | 8.9% | 881,291 | 4.7% | 12,339,571 | 4.1% |
| 2016 | 225,745 | -1.4% | 848,235 | 0.8% | 12,345,948 | 4.1% |
| 2017 | 223,329 | -2.4% | 854,385 | 1.5% | 12,456,179 | 5.1% |
| 2018 | 231,456 | 1.1% | 882,339 | 4.9% | 12,696,998 | 7.1% |
| 2019 | 239,148 | 4.5% | 908,801 | 8.0% | 12,828,307 | 8.2% |
Sources: JobsEQ and Texas Comptroller of Public Accounts
Between 2009 and 2019, the Gulf Coast Region added 625 manufacturing establishments, a 10 percent increase, compared to gains of 9 percent in Texas and 1 percent in the U.S. (Exhibit 4).
Exhibit 4: Total Manufacturing Establishments in Gulf Coast Region, 2009 to 2019
| Year | Gulf Coast Region (total) | Gulf Coast Region | Texas | USA |
|---|---|---|---|---|
| 2009 | 6,151 | 0.0% | 0.0% | 0.0% |
| 2010 | 6,054 | -1.6% | -1.4% | -2.5% |
| 2011 | 6,067 | -1.4% | -1.6% | -4.0% |
| 2012 | 6,104 | -0.8% | -1.9% | -4.7% |
| 2013 | 6,185 | 0.6% | -2.0% | -4.7% |
| 2014 | 6,301 | 2.4% | -1.4% | -3.9% |
| 2015 | 6,462 | 5.1% | 0.4% | -3.0% |
| 2016 | 6,512 | 5.9% | 1.7% | -2.2% |
| 2017 | 6,552 | 6.5% | 3.8% | -1.3% |
| 2018 | 6,551 | 6.5% | 5.7% | 0.0% |
| 2019 | 6,776 | 10.2% | 9.4% | 1.1% |
Sources: JobsEQ and Texas Comptroller of Public Accounts
The region’s manufacturing jobs paid average wages of $89,355 in 2019, far exceeding Texas and U.S. averages. Between 2009 and 2019, average wages rose steadily by 27 percent, in line with increases of 32 percent in Texas and 27 percent in the U.S. (Exhibit 5).
Exhibit 5: Average Wages in Manufacturing Jobs, 2009 to 2019
| Year | Gulf Coast Region | Texas | USA |
|---|---|---|---|
| 2009 | $70,190 | $60,401 | $54,939 |
| 2010 | $73,751 | $63,310 | $57,595 |
| 2011 | $77,095 | $66,075 | $59,277 |
| 2012 | $79,755 | $68,491 | $60,553 |
| 2013 | $79,437 | $68,838 | $61,143 |
| 2014 | $81,879 | $71,171 | $63,024 |
| 2015 | $83,799 | $72,815 | $64,352 |
| 2016 | $84,037 | $73,125 | $64,922 |
| 2017 | $86,942 | $75,806 | $66,898 |
| 2018 | $88,810 | $77,647 | $68,585 |
| 2019 | $89,355 | $79,746 | $69,976 |
Sources: JobsEQ and Texas Comptroller of Public Accounts
The region’s manufacturing GDP also shows the volatility brought on by its connection with the energy industry. Gulf Coast manufacturing GDP rose by an inflation-adjusted 8.0 percent between 2009 and 2019, for an average annual increase of 0.8 percent. The sector’s average annual GDP changes in Texas and the U.S., by contrast, were 2.6 percent and 1.9 percent, respectively (Exhibit 6).
Exhibit 6: Percentage Change in Real Gross Domestic Product, Manufacturing, 2009 to 2019 (Indexed to 2009)
| Year | Gulf Coast Region | Texas | USA |
|---|---|---|---|
| 2009 | 0.0% | 0.0% | 0.0% |
| 2010 | 14.3% | 10.8% | 5.4% |
| 2011 | 15.9% | 15.0% | 5.8% |
| 2012 | 7.2% | 10.9% | 5.1% |
| 2013 | 19.9% | 23.3% | 8.3% |
| 2014 | 0.7% | 11.3% | 10.2% |
| 2015 | 8.7% | 15.0% | 11.7% |
| 2016 | -4.1% | 11.7% | 10.9% |
| 2017 | 0.2% | 18.2% | 13.7% |
| 2018 | 4.0% | 24.4% | 18.5% |
| 2019 | 8.0% | 29.7% | 20.8% |
Sources: U.S Bureau of Economic Analysis and Texas Comptroller of Public Accounts
Pandemic Effects
All Texas industry sectors have been affected by the pandemic to some degree, and manufacturing is no exception. Monthly jobs data show that manufacturing employment in the Houston-The Woodlands-Sugar Land metropolitan area fell by 29,300 (or 12.5 percent) in February 2021 compared to the previous year. This was more than twice that of manufacturing job declines seen in Texas, at -6.0 percent, and more than three times the U.S. decline of -4.1 percent (Exhibit 7). It’s important to note that in addition to the pandemic, the oil and gas industry in early 2020 was hit by simultaneous supply and demand shocks that no doubt contributed to the losses.
Exhibit 7: Changes in Manufacturing Jobs, February 2020 to February 2021
| Metro Area | Manufacturing Jobs | Percent Change (Manufacturing) | Percent Change (Total Employment) |
|---|---|---|---|
| Houston-The Woodlands-Sugar Land MSA | -29,300 | -12.5% | -7.3% |
| Texas | -54,200 | -6.0% | -4.6% |
| United States | -524,000 | -4.1% | -6.0% |
Source: Texas Workforce Commission
Note: Not seasonally adjusted
Key Manufacturing Industries
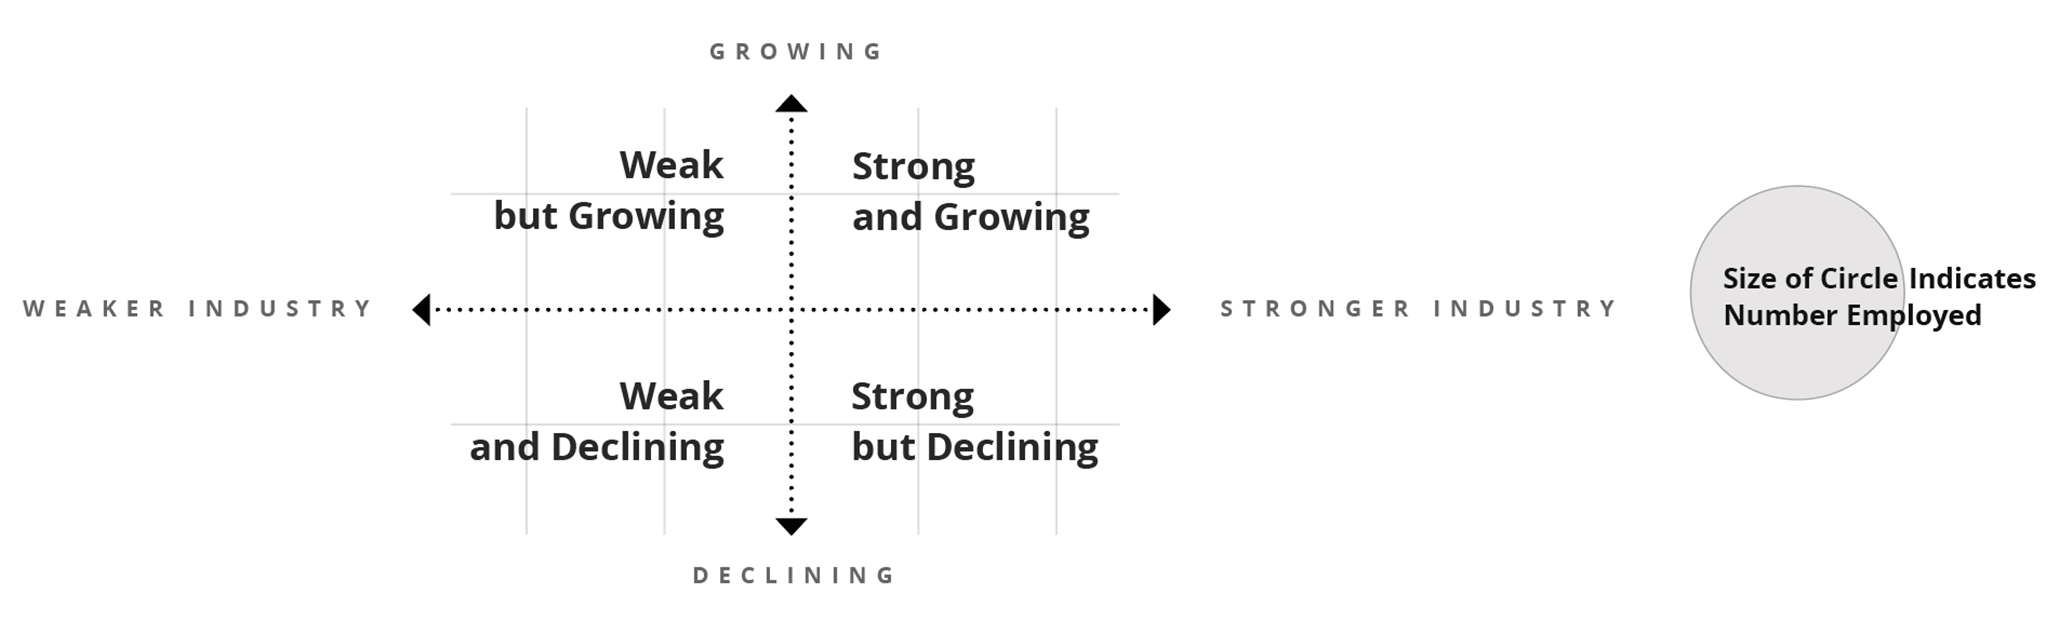
The interactive exhibit (Exhibit 8) displays regional manufacturing industry strengths and weaknesses through the use of two common analytical tools that compare regional manufacturing employment trends to national averages. These tools serve as an educational resource to assess industry strengths and inform development prospects.
First, the location quotient (LQ) measures state and regional industry concentration levels by comparing an industry’s share of total regional employment to its share of total national employment. If the regional industry share exceeds the national share (an LQ greater than 1.00), the industry is more “concentrated” in the region than nationally. A score above 1.00 may indicate that the regional industry is strong and self-sufficient and that it exports its products or services outside of the region. Regional industries with below-average employment concentrations (LQs of less than 1.00) often import goods or services from other areas.
A second tool, shift-share analysis (SSA), measures regional industry employment changes and assesses the role of local competitiveness on gains or losses. The SSA uses national employment and industry trends to produce expected employment changes for a regional industry. If a regional industry’s actual employment changes exceed expected changes (a positive local competitiveness effect), the region may have a productive advantage in the industry. Notably, an industry’s competitive effect value does not always follow its total employment changes. For example, an industry could lose jobs but still have a positive competitiveness value if the region’s competitive factors allowed it to lose fewer jobs than expected.
Notably, an industry’s competitive effect value does not always follow its total employment changes. For example, an industry could gain jobs but still have a negative competitiveness value if the region fails to meet employment expectations. Between 2009 and 2019, total regional manufacturing rose by 4.5 percent (10,227 jobs), but SSA shows the region fell short of expected manufacturing gains by more than 10,000 jobs.
The manufacturing industries plotted in the exhibit fall into one of four quadrants based on 2019 LQ values and SSA values between 2009 and 2019:
- Strong and growing: Industry has above-average concentration levels (2019 LQ value > 1.00) and industry job changes exceeded expected changes between 2009 and 2019 (positive competitiveness effect);
- Strong but declining: Industry has above-average concentration levels (2019 LQ value > 1.00) and industry job changes fell below expected changes between 2009 and 2019 (negative competitiveness effect);
- Weak but growing: Industry has below-average concentration levels (2019 LQ value < 1.00) and industry job changes exceeded expected changes between 2009 and 2019 (positive competitiveness effect); and
- Weak and declining: Industry has below-average concentration levels (2019 LQ value < 1.00) and industry job changes fell below expected changes between 2009 and 2019 (negative competitiveness effect).
The heavily concentrated industry of machinery manufacturing surpassed expectations, but other strong regional industries fell short, including fabricated metals and petroleum manufacturing. Fabricated metals, an industry closely tied to oil and gas, represented 19.7 percent of all manufacturing employment in the region in 2019.
Employment concentrations for many of the region’s other manufacturing industries remain below national averages, yet several show high degrees of competitiveness, including pharmaceuticals and food manufacturing. Such developments could identify emerging industries and prospects for further growth. On the other hand, a number of manufacturing industries saw deeper job losses in the region than expected during this period, including beverages, plastics and rubber, computer and electronic products, motor vehicles and aerospace products.
A note of caution: A positive competitive effect indicates that some economic advantages exist in a region, such as access to natural resources or to a more productive labor pool, management or technologies. The sources of those advantages, however, cannot be identified through SSA.
Exhibit 8: Manufacturing Industries in the Gulf Coast Region, Concentration Levels and Competitiveness
| Industry Title | NAICS | Employment, 2019 | Location Quotient, 2019 | Employment Changes due to Local Competitiveness, 2009-2019 |
|---|---|---|---|---|
| Food Manufacturing | 311 | 12,024 | 0.35 | 1,130 |
| Beverage and Tobacco Product Manufacturing | 312 | 3,880 | 0.64 | -1,158 |
| Textile Mills | 313 | 238 | 0.10 | 75 |
| Textile Product Mills | 314 | 1,236 | 0.52 | 138 |
| Apparel Manufacturing | 315 | 620 | 0.27 | 330 |
| Leather and Allied Product Manufacturing | 316 | 257 | 0.44 | 147 |
| Wood Product Manufacturing | 321 | 3,763 | 0.44 | 196 |
| Paper Manufacturing | 322 | 1,507 | 0.20 | 232 |
| Printing and Related Support Activities | 323 | 5,108 | 0.57 | 331 |
| Petroleum and Coal Products Manufacturing | 324 | 10,223 | 4.28 | -1,881 |
| Chemical Manufacturing (Resource-Intensive Commodities) | 3251-3253 | 28,784 | 4.82 | -806 |
| Pharmaceutical and Medicine Manufacturing | 3254 | 3,020 | 0.47 | 1,652 |
| Chemical Manufacturing (Locally Processed Goods) | 3255-3259 | 8,717 | 1.58 | 235 |
| Plastics and Rubber Products Manufacturing | 326 | 10,858 | 0.70 | -1,346 |
| Nonmetallic Mineral Product Manufacturing | 327 | 7,323 | 0.83 | 206 |
| Primary Metal Manufacturing | 331 | 4,146 | 0.51 | 400 |
| Fabricated Metal Product Manufacturing | 332 | 54,757 | 1.75 | -508 |
| Machinery Manufacturing | 333 | 47,083 | 1.98 | 3,633 |
| Computer and Electronic Product Manufacturing | 334 | 13,234 | 0.58 | -6,645 |
| Electrical Equipment, Appliance, and Component Manufacturing | 335 | 6,521 | 0.77 | -778 |
| Motor Vehicle, Body, and Parts Manufacturing | 3361-3363 | 2,333 | 0.11 | -4,422 |
| Aerospace Product and Parts Manufacturing | 3364 | 1,133 | 0.10 | -1,317 |
| Other Transportation Equipment Manufacturing | 3365-3369 | 1,858 | 0.37 | -722 |
| Furniture and Related Product Manufacturing | 337 | 3,049 | 0.37 | -282 |
| Medical Equipment and Supplies Manufacturing | 3391 | 2,042 | 0.30 | 39 |
| Other Miscellaneous Manufacturing | 3399 | 5,435 | 0.88 | 490 |
| Total - Manufacturing | 239,148 | 0.88 | -10,633 |
Sources: JobsEQ and Texas Comptroller of Public Accounts
Summary
Gulf Coast regional manufacturing is dominated by petroleum and chemical manufacturing, both subject to the volatility of the oil and gas industry. The two severe oil and gas downturns in the last decade were largely responsible for the modest 4.5 percent growth in regional manufacturing seen from 2009 to 2019. Other industries saw net job losses during the period as well.
Still, manufacturing in the Gulf Coast Region in 2019 remained highly significant, responsible for 7.7 percent of the region’s total jobs and $86.5 billion in GDP. Furthermore, the region’s manufacturing jobs pay considerably higher wages than average, at almost $90,000 per year. Manufacturing sectors notable for their growth during the past 10 years include food, pharmaceuticals and machinery.