Skip navigation

Top navigation skipped
Manufacturing in the Upper Rio Grande Region
The six-county Upper Rio Grande (URG) Region covers about 21,700 square miles in western Texas. Its boundary stretches from the most western tip of the state, where the state line meets Mexico and New Mexico, south along the Rio Grande past Big Bend and then northwest to the New Mexico border near Guadalupe Mountains National Park.
The URG Region includes one metropolitan statistical area (MSA): the El Paso MSA comprising El Paso and Hudspeth counties. Counties in the region not associated with an MSA include Brewster, Culberson, Jeff Davis and Presidio. The region’s economic center is the city of El Paso in El Paso County.
In 2019, the URG Region had an estimated population of about 864,500, approximately 3 percent of the state’s total. Its total employment of about 321,800 accounted for 2.6 percent of the state’s total.
The region included about 17,000 manufacturing jobs in 2019, or 5.3 percent of its total employment. Manufacturing’s regional gross domestic product (GDP) of nearly $2.8 billion accounted for 8.2 percent of the total regional GDP of $33.7 billion. The URG Region’s manufacturers paid nearly $835 million in wages in 2019, or 6.5 percent of total regional wages of $12.9 billion. Annual wages for its manufacturing jobs averaged about $49,100 in 2019, higher than the average wage of nearly $40,200 for all regional jobs (Exhibit 1).
Exhibit 1: Manufacturing Overview by County, Upper Rio Grande Region, 2019
| County | Employment | Gross Domestic Product | Wages | ||||
|---|---|---|---|---|---|---|---|
| Total | Share | Total (millions) | Share | Total (millions) | Share | Average Annual Wages |
|
| Brewster | 18 | 0.4% | $4 | 1.0% | $2 | 1.2% | $113,235 |
| Culberson | 66 | 5.5% | (D) | (D) | $3 | 4.7% | $47,007 |
| El Paso | 16,841 | 5.4% | $2,743 | 8.3% | $827 | 6.6% | $49,097 |
| Hudspeth | 15 | 1.0% | (D) | (D) | $1 | 0.8% | $48,264 |
| Jeff Davis | 20 | 2.2% | (D) | (D) | $1 | 1.7% | $26,389 |
| Presidio | 51 | 2.3% | $4 | 1.4% | $2 | 1.7% | $30,968 |
| Upper Rio Grande Region Total | 17,010 | 5.3% | $2,751 | 8.2% | $835 | 6.5% | $49,074 |
| Texas | 908,801 | 7.2% | $241,005 | 13.1% | $72,473 | 9.6% | $79,746 |
(D): data not shown to avoid disclosure of confidential information.
Sources: JobsEQ, U.S. Bureau of Economic Analysis and Texas Comptroller of Public Accounts
In recent decades, manufacturing employment in El Paso and the URG Region has greatly diminished. In 1990, for example, manufacturing jobs in the El Paso MSA totaled more than 41,400, or 20 percent of its total jobs. By 2019, there were about 16,850 manufacturing jobs in El Paso, down to 5.4 percent of its total jobs. Many of the lost manufacturing jobs were in lower-skilled operations, such apparel manufacturing. In El Paso, this industry fell from 16,150 jobs in 1990 to 1,130 in 2019, a decline of 92 percent. These jobs were lost due to automation, technological advancements and the introduction of the North American Free Trade Agreement (NAFTA) in the 1990s.
During that time period, however, El Paso transitioned into a trade and distribution hub, providing new opportunities in business and trade services. Research by the Federal Reserve Bank of Dallas shows that a 10 percent increase in manufacturing on the Mexican side of the border increases employment in El Paso by 2.8 percent. NAFTA also increased production sharing between U.S. and Mexican factories – especially in automotive manufacturing – resulting in lower production costs and more competitively priced products.
The region’s education and research institutions and its economic development advocates are leading efforts to develop advanced manufacturing in the URG Region.
- The Borderplex Alliance serves as an economic development advocate for the Borderplex Region, which includes El Paso, Las Cruces, New Mexico and Ciudad Juarez in the state of Chihuahua, Mexico. The region is the fifth-largest manufacturing hub in North America with more than 360 manufacturing operations.
- The University of Texas at El Paso is home to the W.M. Keck Center for 3D Innovation, focused on the use and development of additive manufacturing technologies.
- El Paso Community College provides programs in advanced manufacturing at its Advanced Technology Center.
Long-Term Regional Trends
Between 2001 and 2019, manufacturing employment in the URG Region fell by about 51 percent, or more than 17,800 jobs. Manufacturing’s share of total regional employment fell significantly, from 13.5 percent in 2001 to 5.3 percent in 2019 (Exhibit 2).
Exhibit 2: Manufacturing Employment and Manufacturing Share of Total Employment, 2001 to 2019, Upper Rio Grande Region
| Year | Total Industry Jobs | Manufacturing Jobs | Manufacturing Share of Total Industry Jobs |
|---|---|---|---|
| 2001 | 257,473 | 34,843 | 13.5% |
| 2002 | 260,154 | 30,406 | 11.7% |
| 2003 | 260,399 | 26,563 | 10.2% |
| 2004 | 262,789 | 24,129 | 9.2% |
| 2005 | 266,546 | 23,058 | 8.7% |
| 2006 | 271,406 | 22,117 | 8.1% |
| 2007 | 276,430 | 20,496 | 7.4% |
| 2008 | 281,271 | 19,740 | 7.0% |
| 2009 | 276,095 | 17,435 | 6.3% |
| 2010 | 280,722 | 16,766 | 6.0% |
| 2011 | 283,784 | 17,595 | 6.2% |
| 2012 | 286,647 | 18,022 | 6.3% |
| 2013 | 290,544 | 18,169 | 6.3% |
| 2014 | 293,873 | 17,231 | 5.9% |
| 2015 | 300,269 | 17,150 | 5.7% |
| 2016 | 306,321 | 17,165 | 5.6% |
| 2017 | 309,971 | 17,012 | 5.5% |
| 2018 | 315,696 | 16,666 | 5.3% |
| 2019 | 321,803 | 17,010 | 5.3% |
Sources: JobsEQ and Texas Comptroller of Public Accounts
The region continued to lose manufacturing jobs between 2009 and 2019, even as sector employment rose in Texas and the U.S. The region lost 425 manufacturing jobs in this period, a decline of 2.4 percent. By comparison, Texas and U.S. manufacturing jobs rose by 8.0 percent and 8.2 percent, respectively (Exhibit 3).
The largest job losses in this period were among the industries of computer and electronic product manufacturing and electrical equipment and appliance manufacturing.
Exhibit 3: Percentage Change in Manufacturing Jobs, 2009 to 2019 (Indexed to 2009)
| Year | Upper Rio Grande Region Jobs | Upper Rio Grande Region Percent Change | Texas Jobs | Texas Percent Change | USA Jobs | USA Percent Change |
|---|---|---|---|---|---|---|
| 17,435 | 0.0% | 0.0% | 0.0% | |||
| 16,766 | -3.8% | -3.2% | -2.7% | |||
| 17,595 | 0.9% | -0.1% | -0.9% | |||
| 18,022 | 3.4% | 3.1% | 0.8% | |||
| 18,169 | 4.2% | 4.3% | 1.6% | |||
| 17,231 | -1.2% | 5.8% | 2.9% | |||
| 17,150 | -1.6% | 4.7% | 4.1% | |||
| 17,165 | -1.5% | 0.8% | 4.1% | |||
| 17,012 | -2.4% | 1.5% | 5.1% | |||
| 16,666 | -4.4% | 4.9% | 7.1% | |||
| 17,010 | -2.4% | 8.0% | 8.2% |
Sources: JobsEQ and Texas Comptroller of Public Accounts
Between 2009 and 2019, the URG Region lost nine manufacturing establishments, a 1.4 percent decrease, compared to gains of 9.4 percent in Texas and 1.1 percent in the U.S. (Exhibit 4).
Exhibit 4: Total Manufacturing Establishments, Upper Rio Grande Region, 2009 to 2019
| Year | Upper Rio Grande Region (total) | Upper Rio Grande Region | Texas | USA |
|---|---|---|---|---|
| 2009 | 640 | 0.0% | 0.0% | 0.0% |
| 2010 | 623 | -2.7% | -1.4% | -2.5% |
| 2011 | 629 | -1.7% | -1.6% | -4.0% |
| 2012 | 612 | -4.4% | -1.9% | -4.7% |
| 2013 | 605 | -5.5% | -2.0% | -4.7% |
| 2014 | 612 | -4.4% | -1.4% | -3.9% |
| 2015 | 618 | -3.4% | 0.4% | -3.0% |
| 2016 | 616 | -3.8% | 1.7% | -2.2% |
| 2017 | 619 | -3.3% | 3.8% | -1.3% |
| 2018 | 616 | -3.8% | 5.7% | 0.0% |
| 2019 | 631 | -1.4% | 9.4% | 1.1% |
Sources: JobsEQ and Texas Comptroller of Public Accounts
The URG Region’s manufacturing jobs paid average wages of nearly $49,100 in 2019, far less than the Texas and U.S. averages of $79,746 and $69,976, respectively (Exhibit 5). Between 2009 and 2019, the region’s average wages rose by 23.2 percent, slower than the gains of 32.0 percent in Texas and 27.4 percent in the U.S.
Exhibit 5: Average Wages in Manufacturing Jobs, 2009 to 2019
| Year | Upper Rio Grande Region | Texas | USA |
|---|---|---|---|
| 2009 | $39,821 | $60,401 | $54,939 |
| 2010 | $41,216 | $63,310 | $57,595 |
| 2011 | $44,280 | $66,075 | $59,277 |
| 2012 | $43,569 | $68,491 | $60,553 |
| 2013 | $44,346 | $68,838 | $61,143 |
| 2014 | $48,718 | $71,171 | $63,024 |
| 2015 | $49,126 | $72,815 | $64,352 |
| 2016 | $46,707 | $73,125 | $64,922 |
| 2017 | $47,992 | $75,806 | $66,898 |
| 2018 | $48,527 | $77,647 | $68,585 |
| 2019 | $49,074 | $79,746 | $69,976 |
Sources: JobsEQ and Texas Comptroller of Public Accounts
The manufacturing sector’s GDP value for the URG Region rose by an inflation-adjusted 19.4 percent between 2009 and 2019, for an average annual increase of 1.8 percent. The sector’s average annual GDP changes in Texas and the U.S., by comparison, were 2.6 percent and 1.9 percent, respectively (Exhibit 6).
Exhibit 6: Percentage Change in Real Gross Domestic Product, Manufacturing, 2009 to 2019 (Indexed to 2009)
| Year | Upper Rio Grande Region | Texas | USA |
|---|---|---|---|
| 2009 | 0.0% | 0.0% | 0.0% |
| 2010 | 8.3% | 10.8% | 5.4% |
| 2011 | 29.7% | 15.0% | 5.8% |
| 2012 | 31.3% | 10.9% | 5.1% |
| 2013 | 30.9% | 23.3% | 8.3% |
| 2014 | 7.5% | 11.3% | 10.2% |
| 2015 | 7.2% | 15.0% | 11.7% |
| 2016 | 7.1% | 11.7% | 10.9% |
| 2017 | 15.2% | 18.2% | 13.7% |
| 2018 | 19.2% | 24.4% | 18.5% |
| 2019 | 19.4% | 29.7% | 20.8% |
Note: Due to GDP data withheld to avoid disclosure of confidential information, the analysis excludes the Upper Rio Grande Region counties of Culberson, Hudspeth, Jeff Davis and Presidio.
Sources: U.S Bureau of Economic Analysis and Texas Comptroller of Public Accounts
Pandemic Effects
All Texas industry sectors have been affected by the pandemic to some degree, and manufacturing is no exception. Monthly jobs data show that manufacturing jobs in the El Paso metropolitan area fell by 900 (or 5.1 percent) in February 2021 compared to the previous year. These losses were slightly better than the sector’s losses of 6.0 percent in Texas during this period (Exhibit 7).
Exhibit 7: Changes in Manufacturing Jobs, February 2020 to February 2021
| Metro Area | Manufacturing Jobs | Percent Change (Manufacturing) | Percent Change (Total Employment) |
|---|---|---|---|
| El Paso | -900 | -5.1% | -3.8% |
| Texas | -54,200 | -6.0% | -4.6% |
| United States | -524,000 | -4.1% | -6.0% |
Note: Not seasonally adjusted.
Source: Texas Workforce Commission
Key Manufacturing Industries
The URG Region’s manufacturing employment fell by 425 jobs, or 2.4 percent, between 2009 and 2019. Some regional industries did see growth, however, led by gains in motor vehicle body and parts manufacturing (up by 511 jobs or 96 percent) and primary metal manufacturing (up by 432 jobs or 46 percent). The largest industry employment losses were in electrical equipment and household appliances (down 817 jobs or 73 percent).
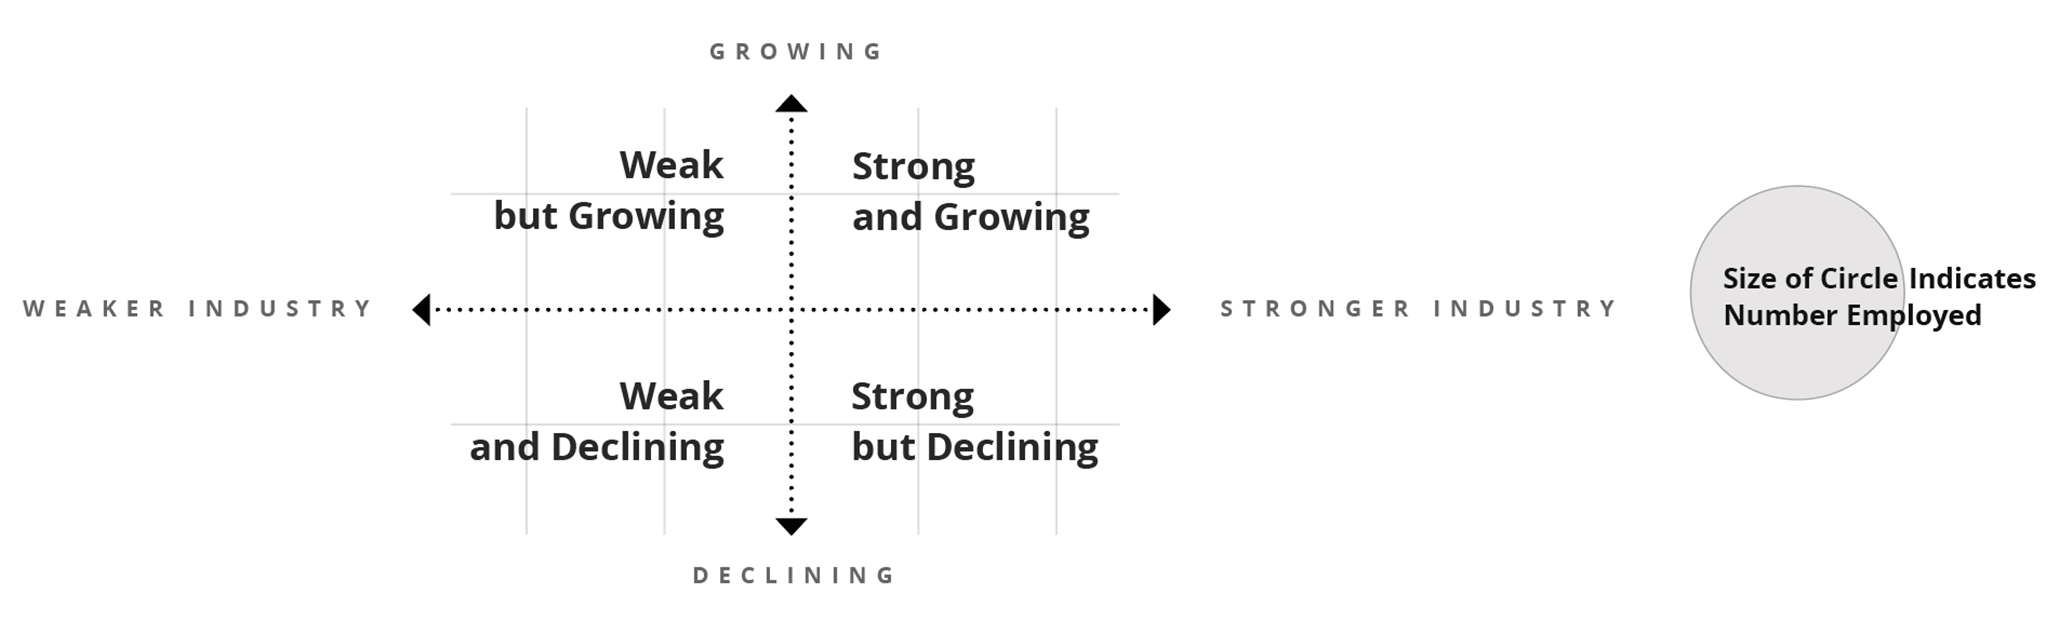
The interactive Exhibit 8 displays regional manufacturing industry strengths and weaknesses through the use of two common analytical tools that compare regional manufacturing employment trends to national averages. These tools serve as an educational resource to inform development prospects and assess industry strengths beyond simple measures of employment change.
First, the location quotient (LQ) measures state and regional industry concentration levels by comparing an industry’s share of total regional employment to its share of total national employment. If the regional industry share exceeds the national share (an LQ greater than 1.00), the industry is more “concentrated” in the region than nationally. A score above 1.00 may indicate that the regional industry is strong and self-sufficient and that it exports its products or services beyond the region. Regional industries with below-average employment concentrations (LQs of less than 1.00) often import goods or services from other areas.
A second tool, shift-share analysis (SSA), measures regional industry job changes and assesses the role of local competitiveness on industry job gains or losses. The SSA uses national employment and industry trends to produce expected employment changes for a regional industry. If a regional industry’s actual employment changes exceed expected changes (a positive local competitiveness effect), the region may have a productive advantage in the industry. Conversely, a negative competitiveness effect indicates that the industry fell short of expected employment changes. Between 2009 and 2019, SSA shows that total manufacturing employment in the URG Region fell short of expected employment changes by about 740 jobs.
The manufacturing industries plotted in the exhibit fall into one of four quadrants based on 2019 LQ values and SSA values between 2009 and 2019:
- Strong and growing: Industry has above-average concentration levels (2019 LQ value > 1.00) and industry job changes exceeded expected changes between 2009 and 2019 (positive competitiveness effect);
- Strong but declining: Industry has above-average concentration levels (2019 LQ value > 1.00) and industry job changes fell below expected changes between 2009 and 2019 (negative competitiveness effect);
- Weak but growing: Industry has below-average concentration levels (2019 LQ value < 1.00) and industry job changes exceeded expected changes between 2009 and 2019 (positive competitiveness effect); and
- Weak and declining: Industry has below-average concentration levels (2019 LQ value < 1.00) and industry job changes fell below expected changes between 2009 and 2019 (negative competitiveness effect).
Apparel manufacturing remains a specialized and unique industry in the URG Region despite its massive job losses in the past 30 years. It is one of the region’s most concentrated industries, with an LQ value of 5.52 in 2019. (In other words, the industry’s share of URG Region employment is about five-and-a-half times as high as the industry’s nationwide share.) The industry experienced slight job losses between 2009 and 2019, but SSA measurements show that it exceeded expected employment changes by 502 jobs, meaning that competitive advantages exist that allowed the region to save more than 500 industry jobs.
Other highly concentrated regional industries that exceeded employment expectations were leather and allied product manufacturing, petroleum products and primary metal manufacturing. Regional industries that exhibited competitive weaknesses between 2009 and 2019 included electrical equipment and appliances, fabricated metal products and nonmetallic mineral products.
The levels of employment concentration for many of the region’s manufacturing industries remain below national averages, yet several show high levels of competitiveness including beverage products, machinery manufacturing and motor vehicle, body and parts manufacturing. Such developments could identify emerging industries and prospects for further growth.
A note of caution: A positive competitive effect indicates that some economic advantages exist in a region, such as access to natural resources or access to a more productive labor pool, management or technologies. A positive competitive effect indicates some economic advantages exist but cannot identify the source of that advantage.
Exhibit 8: Manufacturing Industries in the Upper Rio Grande Region, Concentration Levels and Competitiveness
| Industry Title | NAICS | Employment, 2019 | Location Quotient, 2019 | Employment Changes due to Local Competitiveness, 2009-2019 |
|---|---|---|---|---|
| Food Manufacturing | 311 | 1,813 | 0.51 | -179 |
| Beverage and Tobacco Product Manufacturing | 312 | 555 | 0.88 | 111 |
| Textile Mills | 313 | 118 | 0.50 | -118 |
| Textile Product Mills | 314 | 170 | 0.69 | 61 |
| Apparel Manufacturing | 315 | 1,310 | 5.52 | 502 |
| Leather and Allied Product Manufacturing | 316 | 760 | 12.64 | 11 |
| Wood Product Manufacturing | 321 | 406 | 0.46 | 133 |
| Paper Manufacturing | 322 | 772 | 0.97 | -70 |
| Printing and Related Support Activities | 323 | 570 | 0.61 | 80 |
| Petroleum and Coal Products Manufacturing | 324 | 625 | 2.52 | 185 |
| Chemical Manufacturing (Resource-Intensive Commodities) | 3251-3253 | 12 | 0.02 | -108 |
| Pharmaceutical and Medicine Manufacturing | 3254 | 191 | 0.28 | -51 |
| Chemical Manufacturing (Locally Processed Goods) | 3255-3259 | 105 | 0.18 | 50 |
| Plastics and Rubber Products Manufacturing | 326 | 1,222 | 0.76 | 40 |
| Nonmetallic Mineral Product Manufacturing | 327 | 1,127 | 1.24 | -395 |
| Primary Metal Manufacturing | 331 | 1,377 | 1.63 | 447 |
| Fabricated Metal Product Manufacturing | 332 | 1,951 | 0.60 | -481 |
| Machinery Manufacturing | 333 | 882 | 0.36 | 109 |
| Computer and Electronic Product Manufacturing | 334 | 543 | 0.23 | -314 |
| Electrical Equipment, Appliance, and Component Manufacturing | 335 | 302 | 0.34 | -708 |
| Motor Vehicle, Body, and Parts Manufacturing | 3361-3363 | 1,042 | 0.48 | 377 |
| Aerospace Product and Parts Manufacturing | 3364 | 402 | 0.34 | -93 |
| Other Transportation Equipment Manufacturing | 3365-3369 | 32 | 0.06 | 32 |
| Furniture and Related Product Manufacturing | 337 | 326 | 0.39 | -126 |
| Medical Equipment and Supplies Manufacturing | 3391 | 95 | 0.13 | -39 |
| Other Miscellaneous Manufacturing | 3399 | 302 | 0.47 | -193 |
| Total - Manufacturing | 17,010 | 0.61 | -737 |
Sources: JobsEQ and Texas Comptroller of Public Accounts
Summary
The total number of manufacturing jobs in El Paso and the URG Region greatly diminished in the last several decades, largely due to the impact of NAFTA and other market forces. During this time, however, the region transitioned into an international trade hub, providing new opportunities in logistics and other business services.
Despite overall manufacturing job losses between 2009 and 2019, several regional industries saw employment growth and displayed high degrees of competitiveness, including primary metal manufacturing, petroleum products, motor vehicles and parts and beverage manufacturing.