Skip navigation

Top navigation skipped
Manufacturing in the Central Texas Region
The Central Texas Region includes 20 counties and stretches from Hillsboro on the north to Interstate 45 on the east, and from East Yegua Creek on the south to the conjunction of the San Saba and Colorado rivers. The region includes three metropolitan statistical areas (MSAs): The College Station-Bryan MSA, comprising Brazos, Burleson and Robertson counties; the Waco MSA, comprising Falls and McLennan counties; and the Killeen-Temple MSA, comprising Bell, Coryell and Lampasas counties. Counties in the region not associated with an MSA include Bosque, Freestone, Grimes, Hamilton, Hill, Leon, Limestone, Madison, Milam, Mills, San Saba and Washington counties.
In 2019, the Central Texas Region had an estimated population of 1.2 million (about 4.3 percent of the state total) and accounted for 3.9 percent of the state’s total employment.
The region included about 36,400 manufacturing jobs in 2019, or 8.2 percent of its total employment of nearly 445,000. The sector’s contribution to regional gross domestic product (GDP) and total wages, however, was larger. The manufacturing sector’s regional GDP of $5.8 billion accounted for 10.1 percent of the total regional GDP of $57.1 billion. The Central Texas Region’s manufacturers paid more than $2.1 billion in wages in 2019, or 10.4 percent of total regional wages of $20.3 billion. Annual wages for its manufacturing jobs averaged $57,955 in 2019.
In 2019, manufacturing activity in the region had a large impact on Leon and Grimes counties, contributing 31 percent and 28 percent of total county wages and 23 percent and 17 percent of total GDP, respectively. These results exceeded the regional averages. The counties’ manufacturing jobs also had high average wages, at about $102,600 for Leon County and $66,400 for Grimes County (Exhibit 1).
Sources: JobsEQ, U.S. Bureau of Economic Analysis and Texas Comptroller of Public Accounts
Exhibit 1: Manufacturing Overview by County, Central Texas Region, 2019
County Employment Gross Domestic Product Wages
Total Share Total
(millions)Share Total
(millions)Share Average
Annual Wages
Bell 6,687 5.5% $863 5.0% $352 6.0% $52,592
Bosque 495 13.3% $61 9.9% $27 17.5% $54,796
Brazos 5,158 4.8% $568 5.4% $239 5.2% $46,308
Burleson 409 9.0% $45 3.5% $19 8.6% $45,801
Coryell 410 2.6% $119 6.7% $31 4.5% $75,476
Falls 127 4.0% $15 3.7% $6 4.6% $44,047
Freestone 121 2.6% $16 1.4% $7 3.5% $56,325
Grimes 1,606 21.6% $188 17.0% $107 27.8% $66,384
Hamilton 214 8.2% $19 6.9% $9 9.2% $43,120
Hill 1,184 11.8% $120 11.4% $58 13.6% $49,333
Lampasas 559 12.0% $55 10.9% $22 12.8% $38,685
Leon 843 16.7% $169 22.6% $87 30.9% $102,623
Limestone 379 4.3% $64 4.0% $15 3.8% $39,091
Madison 252 5.8% $57 9.6% $13 7.5% $51,425
McLennan 14,965 13.2% $3,022 22.9% $963 18.1% $64,328
Milam 214 4.1% $40 5.6% $18 8.4% $85,685
Mills 106 8.3% $8 3.7% $3 7.3% $30,542
Robertson 82 1.9% $12 0.6% $5 2.5% $61,693
San Saba 47 2.5% $4 1.8% $1 1.4% $23,498
Washington 2,531 16.7% $343 18.5% $129 20.7% $50,806
Central Texas Region Total 36,388 8.2% $5,787 10.1% $2,109 10.4% $57,955
Texas 908,801 7.2% $241,005 13.1% $72,473 9.6% $79,746
The region’s cities, counties, colleges and manufacturers are focused on buoying the manufacturing industry by offering opportunities for skilled workforce and industry growth. Examples include:
- The Brazos Valley Council of Governments Economic Development Program assists manufacturing firms looking to move to or expand in the Central Texas Region. Guidance with economic development connections, demographic and analytical research and workforce development is provided.
- Fujifilm Diosynth Biotechnologies is expanding its College Station facility with a capital investment of about $120 million. This 60,000-square-foot Gene Therapy Innovation Center should be operational by fall 2021.
- Battery maker East Penn Manufacturing Co. invested $106 million with a plan to create 266 new jobs to expand its facility. East Penn was awarded about $1.3 million in incentives from the Texas Enterprise Fund for this project.
- The Gate Precast Co. recently announced the expansion of its Hillsboro operations by adding a structural concrete plant to produce parking garages, producing the components required for garage construction.
- The Central Texas Region, especially the Killeen area, is unique in its relationship with Fort Hood. Local community colleges, including Central Texas College and Temple College, offer programs showing how military experience can translate to college credit and the workforce.
- Hill College joined its NC3 partnership through the Lincoln Electric Education Partner Schools welding certification program, which allows students to obtain welding certification in areas from safety to flux-cored arc welding to gas metal arc welding and gas tungsten arc welding.
- The Manufacturing Technician Program at Blinn College trains students for careers in machining technology, including instruction on producing precision parts, instruments and tools as well as industry safety and production quality.
Long-Term Regional Trends
Between 2001 and 2019, manufacturing employment in the Central Texas Region fell by about 9.6 percent, or nearly 4,000 jobs. Manufacturing’s share of total regional employment fell from 11.3 percent to 8.2 percent in this period (Exhibit 2).
Exhibit 2: Manufacturing Employment and Manufacturing Share of Total Employment, 2001 to 2019, Central Texas Region
| Year | Total Industry Jobs | Manufacturing Jobs | Manufacturing Share of Total Industry Jobs |
|---|---|---|---|
| 2001 | 355,420 | 40,239 | 11.3% |
| 2002 | 357,119 | 38,371 | 10.7% |
| 2003 | 356,737 | 36,124 | 10.1% |
| 2004 | 363,154 | 36,598 | 10.1% |
| 2005 | 374,150 | 39,477 | 10.6% |
| 2006 | 380,959 | 39,920 | 10.5% |
| 2007 | 384,898 | 39,813 | 10.3% |
| 2008 | 393,763 | 39,025 | 9.9% |
| 2009 | 389,628 | 35,065 | 9.0% |
| 2010 | 392,697 | 34,510 | 8.8% |
| 2011 | 393,798 | 34,716 | 8.8% |
| 2012 | 398,296 | 36,449 | 9.2% |
| 2013 | 406,472 | 36,520 | 9.0% |
| 2014 | 415,040 | 37,343 | 9.0% |
| 2015 | 423,721 | 37,318 | 8.8% |
| 2016 | 427,984 | 36,216 | 8.5% |
| 2017 | 434,481 | 36,856 | 8.5% |
| 2018 | 438,745 | 37,631 | 8.6% |
| 2019 | 444,770 | 36,388 | 8.2% |
Sources: JobsEQ and Texas Comptroller of Public Accounts
The region recovered some manufacturing jobs between 2009 and 2019, adding more than 1,300 jobs for a 3.8 percent increase. By comparison, Texas and U.S. manufacturing jobs rose by 8.0 percent and 8.2 percent, respectively (Exhibit 3).
Exhibit 3: Percentage Change in Manufacturing Jobs, 2009 to 2019 (Indexed to 2009)
| Year | Central Texas Region Jobs | Central Texas Region Percent Change | Texas Jobs | Texas Percent Change | USA Jobs | USA Percent Change |
|---|---|---|---|---|---|---|
| 2009 | 35,065 | 0.0% | 841,353 | 0.0% | 11,854,159 | 0.0% |
| 2010 | 34,510 | -1.6% | 814,265 | -3.2% | 11,532,264 | -2.7% |
| 2011 | 34,716 | -1.0% | 840,195 | -0.1% | 11,748,311 | -0.9% |
| 2012 | 36,449 | 3.9% | 867,771 | 3.1% | 11,950,974 | 0.8% |
| 2013 | 36,520 | 4.1% | 877,534 | 4.3% | 12,040,273 | 1.6% |
| 2014 | 37,343 | 6.5% | 890,468 | 5.8% | 12,202,119 | 2.9% |
| 2015 | 37,318 | 6.4% | 881,291 | 4.7% | 12,339,571 | 4.1% |
| 2016 | 36,216 | 3.3% | 848,235 | 0.8% | 12,345,948 | 4.1% |
| 2017 | 36,856 | 5.1% | 854,385 | 1.5% | 12,456,179 | 5.1% |
| 2018 | 37,631 | 7.3% | 882,339 | 4.9% | 12,696,998 | 7.1% |
| 2019 | 36,388 | 3.8% | 908,801 | 8.0% | 12,828,307 | 8.2% |
Sources: JobsEQ and Texas Comptroller of Public Accounts
Between 2009 and 2019, the Central Texas Region added 923 manufacturing establishments, a 7.3 percent increase, compared to gains of 9 percent in Texas and 1 percent in the U.S. (Exhibit 4).
Exhibit 4: Total Manufacturing Establishments in Central Texas Region, 2009 to 2019
| Year | Central Texas Region (total) | Central Texas Region | Texas | USA |
|---|---|---|---|---|
| 2009 | 860 | 0.0% | 0.0% | 0.0% |
| 2010 | 861 | 0.1% | -1.4% | -2.5% |
| 2011 | 863 | 0.3% | -1.6% | -4.0% |
| 2012 | 862 | 0.2% | -1.9% | -4.7% |
| 2013 | 837 | -2.7% | -2.0% | -4.7% |
| 2014 | 826 | -4.0% | -1.4% | -3.9% |
| 2015 | 843 | -2.0% | 0.4% | -3.0% |
| 2016 | 855 | -0.6% | 1.7% | -2.2% |
| 2017 | 888 | 3.3% | 3.8% | -1.3% |
| 2018 | 901 | 4.8% | 5.7% | 0.0% |
| 2019 | 923 | 7.3% | 9.4% | 1.1% |
Sources: JobsEQ and Texas Comptroller of Public Accounts
The region’s manufacturing jobs paid average wages of $57,955 in 2019, lower than the Texas and U.S. averages. Between 2009 and 2019, its average wages rose by 23 percent, versus 32 percent in Texas and 27 percent in the U.S. (Exhibit 5).
Exhibit 5: Average Wages in Manufacturing Jobs, 2009 to 2019
| Year | Central Texas Region | Texas | USA |
|---|---|---|---|
| 2009 | $46,987 | $60,401 | $54,939 |
| 2010 | $48,523 | $63,310 | $57,595 |
| 2011 | $50,531 | $66,075 | $59,277 |
| 2012 | $51,854 | $68,491 | $60,553 |
| 2013 | $51,895 | $68,838 | $61,143 |
| 2014 | $52,787 | $71,171 | $63,024 |
| 2015 | $53,189 | $72,815 | $64,352 |
| 2016 | $53,971 | $73,125 | $64,922 |
| 2017 | $56,055 | $75,806 | $66,898 |
| 2018 | $58,109 | $77,647 | $68,585 |
| 2019 | $57,955 | $79,746 | $69,976 |
Sources: JobsEQ and Texas Comptroller of Public Accounts
The manufacturing sector’s GDP value for the Central Texas Region rose by an inflation-adjusted 34.5 percent between 2009 and 2019. The sector’s ten-year GDP change for Texas and the U.S., by comparison, were 29.7 percent and 20.8 percent, respectively (Exhibit 6).
Exhibit 6: Percentage Change in Real Gross Domestic Product, Manufacturing, 2009 to 2019 (Indexed to 2009)
| Year | Central Texas Region | Texas | USA |
|---|---|---|---|
| 2009 | 0.0% | 0.0% | 0.0% |
| 2010 | -0.2% | 10.8% | 5.4% |
| 2011 | 11.0% | 15.0% | 5.8% |
| 2012 | 22.8% | 10.9% | 5.1% |
| 2013 | 40.6% | 23.3% | 8.3% |
| 2014 | 43.5% | 11.3% | 10.2% |
| 2015 | 34.2% | 15.0% | 11.7% |
| 2016 | 26.1% | 11.7% | 10.9% |
| 2017 | 27.0% | 18.2% | 13.7% |
| 2018 | 34.3% | 24.4% | 18.5% |
| 2019 | 34.5% | 29.7% | 20.8% |
Sources: U.S Bureau of Economic Analysis and Texas Comptroller of Public Accounts
Pandemic Effects
All Texas industry sectors have been affected by the pandemic to some degree, and manufacturing is no exception. Monthly jobs data show that manufacturing jobs in the three MSAs within the region all declined in February 2021 compared to the previous year. College Station-Bryan MSA lost 500 jobs (-8.8 percent), Killeen-Temple MSA lost 400 jobs (-5.1 percent) and Waco MSA lost 600 jobs (-3.8 percent). This decline stands in comparison to manufacturing job declines in Texas (-6.0 percent) and the U.S. (-4.1 percent) in this period (Exhibit 7).
Exhibit 7: Changes in Manufacturing Jobs, February 2020 to February 2021
| Metro Area | Manufacturing Jobs | Percent Change (Manufacturing) | Percent Change (Total Employment) |
|---|---|---|---|
| College Station-Bryan MSA | -500 | -8.8% | -5.2% |
| Killeen-Temple MSA | -400 | -5.1% | -3.4% |
| Waco MSA | -600 | -3.8% | -0.6% |
| Texas | -54,200 | -6.0% | -4.6% |
| United States | -524,000 | -4.1% | -6.0% |
Source: Texas Workforce Commission
Note: Not seasonally adjusted
Key Manufacturing Industries
The interactive exhibit (Exhibit 8) displays regional manufacturing industry strengths and weaknesses through the use of two common analytical tools that compare regional manufacturing employment trends to national averages. These tools serve as an educational resource to assess industry strengths and inform development prospects.
First, the location quotient (LQ) measures state and regional industry concentration levels by comparing an industry’s share of total regional employment to its share of total national employment. If the regional industry share exceeds the national share (an LQ greater than 1.00), the industry is more “concentrated” in the region than nationally. A score above 1.00 may indicate that the regional industry is strong and self-sufficient and that it exports its products or services outside of the region. Regional industries with below-average employment concentrations (LQs of less than 1.00) often import goods or services from other areas.
A second tool, shift-share analysis (SSA), measures regional industry employment changes and assesses the role of local competitiveness on gains or losses. The SSA uses national employment and industry trends to produce expected employment changes for a regional industry. If a regional industry’s actual employment changes exceed expected changes (a positive local competitiveness effect), the region may have a productive advantage in the industry. Notably, an industry’s competitive effect value does not always follow its total employment changes. For example, an industry could lose jobs but still have a positive competitiveness value if the region’s competitive factors allowed it to lose fewer jobs than expected.
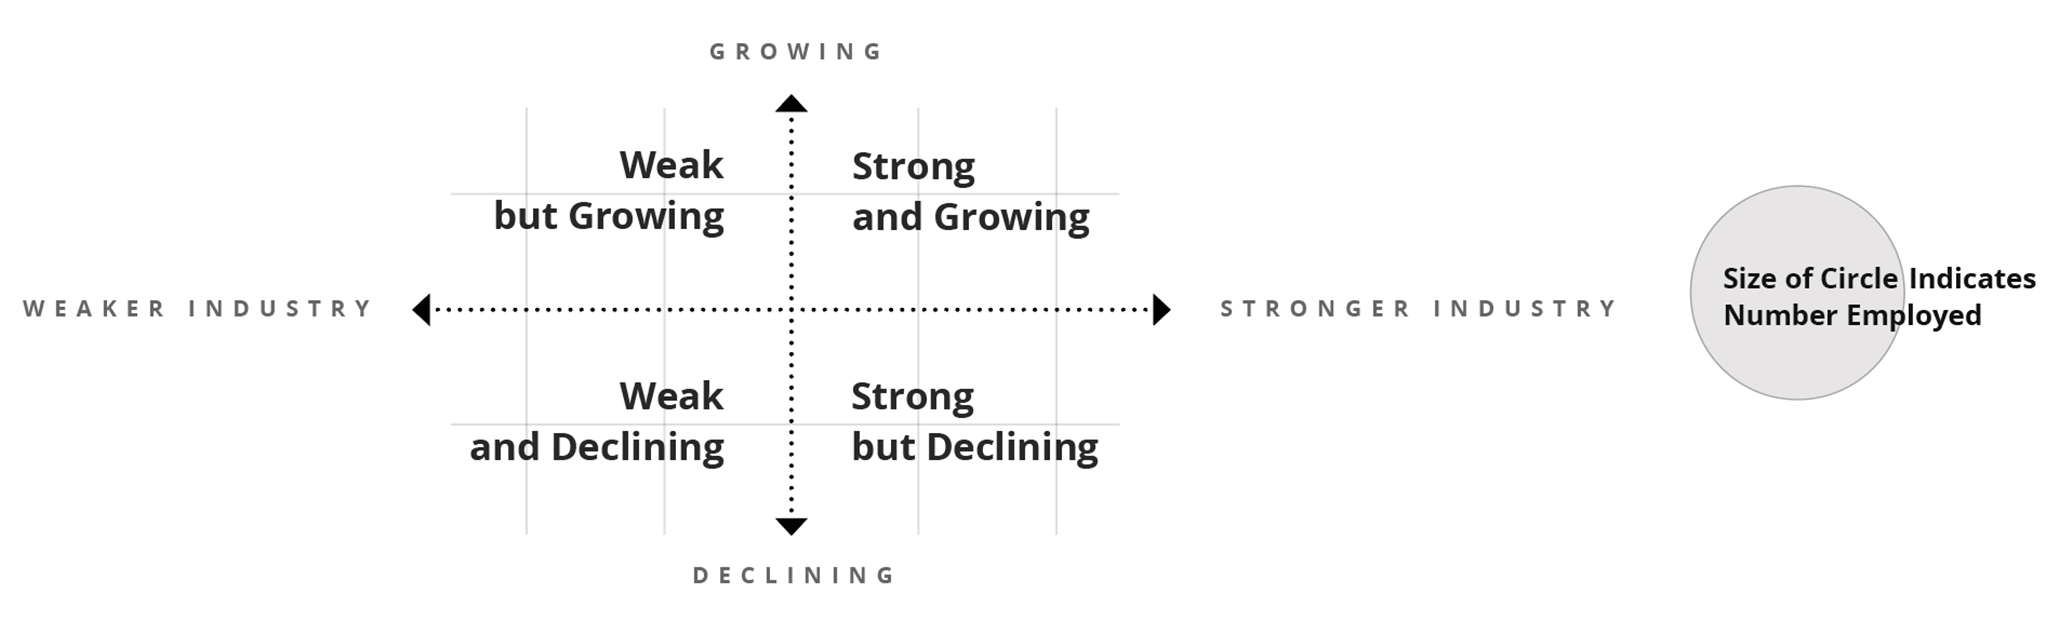
The Central Texas Region’s manufacturing industries plotted in the exhibit fall into one of four quadrants based on 2019 LQ values and SSA values between 2009 and 2019:
- Strong and growing: Industry has above-average concentration levels (2019 LQ value > 1.00) and industry job changes exceeded expected changes between 2009 and 2019 (positive competitiveness effect);
- Strong but declining: Industry has above-average concentration levels (2019 LQ value > 1.00) and industry job changes fell below expected changes between 2009 and 2019 (negative competitiveness effect);
- Weak but growing: Industry has below-average concentration levels (2019 LQ value < 1.00) and industry job changes exceeded expected changes between 2009 and 2019 (positive competitiveness effect); and
- Weak and declining: Industry has below-average concentration levels (2019 LQ value < 1.00) and industry job changes fell below expected changes between 2009 and 2019 (negative competitiveness effect).
While total manufacturing is slightly less concentrated in the Central Texas Region than in the U.S. (2019 LQ = 0.92), a wide variety of industries are highly concentrated. And among these industries, several exceeded expected employment changes between 2009 and 2019, including paper manufacturing, wood products, food manufacturing, primary metals, pharmaceuticals and medicine, and beverage products. Other highly concentrated regional industries that fell short of employment expectations were furniture and related products, aerospace products, nonmetallic mineral products, fabricated metals, and plastics and rubber products.
The food manufacturing industry is highly important to the region — its 7,181 jobs in 2019 accounted for 20 percent of the Central Texas Region’s total manufacturing employment. The industry also led job growth, adding 1,815 regional jobs between 2009 and 2019, a 33.8 percent increase. SSA indicates that industry employment growth exceeded expected gains by 1,342 jobs during this period, indicating much of this growth was due to competitive advantages in the region.
Computer and electronic product manufacturing sustained the heaviest employment losses, falling by 1,864 jobs in the region, a 73.2 percent decline. SSA shows that the regional industry fell short of employment changes by 1,646 jobs.
A note of caution: A positive competitive effect indicates that some economic advantages exist in a region, such as access to natural resources or access to a more productive labor pool, management or technologies. A positive competitive effect indicates some economic advantages exist but cannot identify the source of that advantage through SSA.
Exhibit 8: Manufacturing Industries in the Central Texas Region, Concentration Levels and Competitiveness
| Industry Title | NAICS | Employment, 2019 | Location Quotient, 2019 | Employment Changes due to Local Competitiveness, 2009-2019 |
|---|---|---|---|---|
| Food Manufacturing | 311 | 7,181 | 1.42 | 1,342 |
| Beverage and Tobacco Product Manufacturing | 312 | 925 | 1.04 | 178 |
| Textile Mills | 313 | 226 | 0.67 | -164 |
| Textile Product Mills | 314 | 264 | 0.76 | -11 |
| Apparel Manufacturing | 315 | 75 | 0.22 | 25 |
| Leather and Allied Product Manufacturing | 316 | 39 | 0.46 | -65 |
| Wood Product Manufacturing | 321 | 1,928 | 1.53 | 0 |
| Paper Manufacturing | 322 | 1,911 | 1.70 | 474 |
| Printing and Related Support Activities | 323 | 776 | 0.59 | -175 |
| Petroleum and Coal Products Manufacturing | 324 | 176 | 0.50 | -64 |
| Chemical Manufacturing (Resource-Intensive Commodities) | 3251-3253 | 353 | 0.40 | 298 |
| Pharmaceutical and Medicine Manufacturing | 3254 | 1,112 | 1.18 | 516 |
| Chemical Manufacturing (Locally Processed Goods) | 3255-3259 | 195 | 0.24 | 60 |
| Plastics and Rubber Products Manufacturing | 326 | 2,429 | 1.07 | -1,124 |
| Nonmetallic Mineral Product Manufacturing | 327 | 1,909 | 1.48 | -524 |
| Primary Metal Manufacturing | 331 | 1,700 | 1.42 | 225 |
| Fabricated Metal Product Manufacturing | 332 | 5,192 | 1.13 | -252 |
| Machinery Manufacturing | 333 | 2,925 | 0.84 | 224 |
| Computer and Electronic Product Manufacturing | 334 | 684 | 0.21 | -1,646 |
| Electrical Equipment, Appliance, and Component Manufacturing | 335 | 320 | 0.26 | -212 |
| Motor Vehicle, Body, and Parts Manufacturing | 3361-3363 | 1,094 | 0.35 | -184 |
| Aerospace Product and Parts Manufacturing | 3364 | 2,082 | 1.26 | -7 |
| Other Transportation Equipment Manufacturing | 3365-3369 | 0 | 0.00 | -149 |
| Furniture and Related Product Manufacturing | 337 | 2,184 | 1.83 | -128 |
| Medical Equipment and Supplies Manufacturing | 3391 | 228 | 0.23 | -142 |
| Other Miscellaneous Manufacturing | 3399 | 482 | 0.53 | -324 |
| Total - Manufacturing | 36,388 | 0.92 | -1,829 |
Sources: JobsEQ and Texas Comptroller of Public Accounts
Summary
The Central Texas region has a wide variety of strong and competitive manufacturing industries. Several of these industries saw job gains between 2009 and 2019 that exceeded expectations – notably food manufacturing, paper manufacturing, and pharmaceutical and medicine manufacturing. The region, however, experienced heavy employment losses in its computer and electronics industry, which slowed total manufacturing growth. In all, manufacturing employment in the Central Texas Region rose by nearly 4 percent between 2009 and 2019, lagging state and national overall growth for that period.