Skip navigation

Top navigation skipped
Manufacturing in the Northwest Region
The Northwest Region of Texas includes 30 counties. It stretches from Oklahoma on the north to the Colorado River on the south and sits between Big Spring to the west and the Fort Worth metro area to the east. The region includes two metropolitan statistical areas (MSAs): the Abilene MSA, which is the region’s economic center comprising Callahan, Jones and Taylor counties, and the Wichita Falls MSA, comprising Archer, Clay and Wichita counties. Counties in the region not associated with an MSA include Baylor, Brown, Coleman, Comanche, Cottle, Eastland, Fisher, Foard, Hardeman, Haskell, Jack, Kent, Knox, Mitchell, Montague, Nolan, Runnels, Scurry, Shackelford, Stephens, Stonewall, Throckmorton, Wilbarger and Young counties.
In 2019, the Northwest Region had an estimated population of about 550,500 (about 1.9 percent of the state total) and accounted for 1.6 percent of the state’s total employment.
The region included an estimated 17,668 manufacturing jobs in 2019, about 8.5 percent of its total employment of 207,522. The manufacturing sector’s regional gross domestic product (GDP) of $2.4 billion accounted for 9.8 percent of the total regional GDP of $25 billion. The Northwest Region’s manufacturers paid $951.7 million in wages in 2019, about 10.7 percent of total regional wages of $8.9 billion. Annual wages for its manufacturing jobs averaged nearly $53,866 in 2019, compared to average wages of about $42,801 for all regional jobs.
In 2019, most of the region’s manufacturing activity was centered in three counties: Brown (Brownwood), Taylor (Abilene) and Wichita (Wichita Falls). Together, these counties accounted for nearly two-thirds of the region’s manufacturing jobs, wages and GDP (Exhibit 1).
Exhibit 1: Manufacturing Overview by County, Northwest Region, 2019
| County | Employment | Gross Domestic Product | Wages | ||||
|---|---|---|---|---|---|---|---|
| Total | Share | Total (millions) | Share | Total (millions) | Share | Average Annual Wages |
|
| Archer | 82 | 4.6% | $8 | 2.5% | $3.1 | 4.6% | $37,799 |
| Baylor | 24 | 1.7% | $3 | 1.7% | $1.1 | 2.3% | $46,766 |
| Brown | 2,808 | 18.1% | $399 | 25.8% | $174.7 | 29.1% | $62,196 |
| Callahan | 159 | 6.2% | $14 | 4.4% | $6.7 | 6.2% | $41,899 |
| Clay | 66 | 4.5% | $8 | 3.2% | $3.4 | 6.0% | $50,959 |
| Coleman | 137 | 7.0% | $9 | 3.9% | $4.6 | 7.2% | $33,849 |
| Comanche | 181 | 4.7% | $24 | 5.2% | $6.7 | 4.9% | $37,068 |
| Cottle | 0 | 0.0% | $0 | 0.1% | $0.0 | 0.0% | |
| Eastland | 603 | 7.8% | $63 | 6.8% | $27.3 | 6.7% | $45,233 |
| Fisher | 99 | 12.0% | (D) | (D) | $5.2 | 14.6% | $53,092 |
| Foard | 66 | 17.6% | (D) | (D) | $1.4 | 12.2% | $21,065 |
| Hardeman | 178 | 13.7% | (D) | (D) | $7.4 | 15.3% | $41,375 |
| Haskell | 20 | 1.4% | $2 | 0.7% | $0.8 | 1.8% | $42,606 |
| Jack | 55 | 2.1% | $6 | 1.3% | $2.9 | 2.2% | $52,098 |
| Jones | 175 | 5.8% | $17 | 3.5% | $6.4 | 5.4% | $36,649 |
| Kent | 0 | 0.0% | $1 | 0.3% | 0.0% | ||
| Knox | 19 | 1.8% | (D) | (D) | $0.8 | 1.7% | $41,707 |
| Mitchell | 51 | 2.6% | (D) | (D) | $3.0 | 3.5% | $58,780 |
| Montague | 442 | 9.0% | $39 | 5.2% | $21.3 | 10.3% | $48,294 |
| Nolan | 871 | 13.8% | $173 | 16.6% | $53.6 | 18.9% | $61,494 |
| Runnels | 420 | 14.5% | $69 | 19.2% | $20.1 | 18.3% | $47,805 |
| Scurry | 182 | 2.8% | $27 | 1.6% | $13.7 | 3.7% | $75,022 |
| Shackelford | 120 | 9.0% | (D) | (D) | $7.2 | 9.2% | $59,768 |
| Stephens | 754 | 22.7% | $72 | 16.4% | $25.2 | 19.4% | $33,410 |
| Stonewall | 0 | 0.0% | $1 | 0.6% | 0.0% | ||
| Taylor | 2,845 | 4.4% | $296 | 4.3% | $129.5 | 4.6% | $45,505 |
| Throckmorton | 25 | 6.5% | (D) | (D) | $0.7 | 6.1% | $29,483 |
| Wichita | 5,078 | 9.3% | $851 | 13.9% | $303.1 | 13.3% | $59,702 |
| Wilbarger | 921 | 15.6% | $140 | 16.7% | $46.8 | 20.7% | $50,816 |
| Young | 1,287 | 19.2% | $222 | 24.9% | $75.1 | 25.8% | $58,330 |
| Northwest Region Total | 17,668 | 8.5% | $2,444 | 9.8% | $952 | 10.7% | $53,866 |
| Texas | 908,801 | 7.2% | $241,005 | 13.1% | $72,473 | 9.6% | $79,746 |
(D): data not shown to avoid disclosure of confidential information.
Sources: JobsEQ, U.S. Bureau of Economic Analysis and Texas Comptroller of Public Accounts
Manufacturing in the Northwest Region comprises a variety of industrial sectors, including these:
- Abimar Foods provides bakery products to customers in the U.S., Mexico, Central America and the Caribbean. It is one of the 10 largest employers in Abilene.
- Air Tractor, located in Olney, is an employee-owned manufacturer of agricultural, firefighting and utility aircraft.
- Arconic, a company specializing in lightweight metals for engineering, operates a plant in Wichita Falls that manufactures jet engine blades and vanes.
- Georgia-Pacific is building a second gypsum wallboard production facility adjacent to its existing gypsum plant near Sweetwater. The new $285 million plant, expected to employ 120 employees when completed in 2022, will incorporate state-of-the-art production processes.
- Kohler, one of the largest plumbing products companies in the U.S., is among the leading employers in Brownwood. It produces vitreous china plumbing fixtures in a 1.1-million-square foot plant set on 186 acres.
- TRC Recreation, which has facilities in both Wichita Falls and Graham, manufactures vinyl-coated foam flotation devices, including ski vests, koozies and more.
Long-Term Regional Trends
Between 2001 and 2019, manufacturing employment in the Northwest Region fell by 20.3 percent or 4,510 jobs. Manufacturing’s share of total regional employment fell from 11.3 percent to 8.5 percent in this period (Exhibit 2).
Exhibit 2: Manufacturing Employment and Manufacturing Share of Total Employment, 2001 to 2019, Northwest Region
| Year | Total Industry Jobs | Manufacturing Jobs | Manufacturing Share of Total Industry Jobs |
|---|---|---|---|
| 2001 | 196,798 | 22,178 | 11.3% |
| 2002 | 196,015 | 21,009 | 10.7% |
| 2003 | 193,809 | 19,074 | 9.8% |
| 2004 | 193,835 | 19,367 | 10.0% |
| 2005 | 197,700 | 20,290 | 10.3% |
| 2006 | 202,411 | 21,058 | 10.4% |
| 2007 | 204,631 | 21,103 | 10.3% |
| 2008 | 208,190 | 20,239 | 9.7% |
| 2009 | 200,233 | 17,537 | 8.8% |
| 2010 | 198,629 | 16,114 | 8.1% |
| 2011 | 200,611 | 16,036 | 8.0% |
| 2012 | 203,128 | 16,569 | 8.2% |
| 2013 | 204,747 | 16,517 | 8.1% |
| 2014 | 207,352 | 16,599 | 8.0% |
| 2015 | 206,043 | 16,690 | 8.1% |
| 2016 | 201,329 | 16,358 | 8.1% |
| 2017 | 203,200 | 16,596 | 8.2% |
| 2018 | 206,692 | 17,601 | 8.5% |
| 2019 | 207,522 | 17,668 | 8.5% |
Sources: JobsEQ and Texas Comptroller of Public Accounts
Following the Great Recession, manufacturing jobs in Texas and the U.S. increased by 8.0 percent and 8.2 percent, respectively, between 2009 and 2019. In the Northwest Region, however, manufacturing job recovery was stagnant with a gain of only 0.7 percent (Exhibit 3).
Exhibit 3: Percentage Change in Manufacturing Jobs, 2009 to 2019 (Indexed to 2009)
| Year | Northwest Region Jobs | Northwest Region Percent Change | Texas Jobs | Texas Percent Change | USA Jobs | USA Percent Change |
|---|---|---|---|---|---|---|
| 2009 | 17,537 | 0.0% | 841,353 | 0.0% | 11,854,159 | 0.0% |
| 2010 | 16,114 | -8.1% | 814,265 | -3.2% | 11,532,264 | -2.7% |
| 2011 | 16,036 | -8.6% | 840,195 | -0.1% | 11,748,311 | -0.9% |
| 2012 | 16,569 | -5.5% | 867,771 | 3.1% | 11,950,974 | 0.8% |
| 2013 | 16,517 | -5.8% | 877,534 | 4.3% | 12,040,273 | 1.6% |
| 2014 | 16,599 | -5.3% | 890,468 | 5.8% | 12,202,119 | 2.9% |
| 2015 | 16,690 | -4.8% | 881,291 | 4.7% | 12,339,571 | 4.1% |
| 2016 | 16,358 | -6.7% | 848,235 | 0.8% | 12,345,948 | 4.1% |
| 2017 | 16,596 | -5.4% | 854,385 | 1.5% | 12,456,179 | 5.1% |
| 2018 | 17,601 | 0.4% | 882,339 | 4.9% | 12,696,998 | 7.1% |
| 2019 | 17,668 | 0.7% | 908,801 | 8.0% | 12,828,307 | 8.2% |
Sources: JobsEQ and Texas Comptroller of Public Accounts
Between 2009 and 2019, the Northwest Region lost 37 manufacturing establishments, a 6.6 percent decrease, compared to gains of 9.4 percent in Texas and 1.1 percent in the U.S. (Exhibit 4).
Exhibit 4: Total Manufacturing Establishments in Northwest Region, 2009 to 2019
| Year | Northwest Region (total) | Northwest Region | Texas | USA |
|---|---|---|---|---|
| 2009 | 557 | 0.0% | 0.0% | 0.0% |
| 2010 | 538 | -3.4% | -1.4% | -2.5% |
| 2011 | 520 | -6.6% | -1.6% | -4.0% |
| 2012 | 519 | -6.8% | -1.9% | -4.7% |
| 2013 | 520 | -6.6% | -2.0% | -4.7% |
| 2014 | 518 | -7.0% | -1.4% | -3.9% |
| 2015 | 507 | -9.0% | 0.4% | -3.0% |
| 2016 | 503 | -9.7% | 1.7% | -2.2% |
| 2017 | 491 | -11.8% | 3.8% | -1.3% |
| 2018 | 517 | -7.2% | 5.7% | 0.0% |
| 2019 | 520 | -6.6% | 9.4% | 1.1% |
Sources: JobsEQ and Texas Comptroller of Public Accounts
The region’s manufacturing jobs paid average wages of $53,866 in 2019, far less than the Texas and U.S. averages. Between 2009 and 2019, its average wages rose by 22.7 percent, versus 32.0 percent in Texas and 27.4 percent in the U.S. (Exhibit 5).
Exhibit 5: Average Wages in Manufacturing Jobs, 2009 to 2019
| Year | Northwest Region | Texas | USA |
|---|---|---|---|
| 2009 | $43,904 | $60,401 | $54,939 |
| 2010 | $43,541 | $63,310 | $57,595 |
| 2011 | $45,160 | $66,075 | $59,277 |
| 2012 | $46,257 | $68,491 | $60,553 |
| 2013 | $47,106 | $68,838 | $61,143 |
| 2014 | $50,471 | $71,171 | $63,024 |
| 2015 | $50,687 | $72,815 | $64,352 |
| 2016 | $51,242 | $73,125 | $64,922 |
| 2017 | $52,552 | $75,806 | $66,898 |
| 2018 | $54,137 | $77,647 | $68,585 |
| 2019 | $53,866 | $79,746 | $69,976 |
Sources: JobsEQ and Texas Comptroller of Public Accounts
The manufacturing sector’s GDP value for the Northwest Region rose by an inflation-adjusted 23.5 percent between 2009 and 2019, for an average annual increase of 2.1 percent. The sector’s average annual GDP changes in Texas and the U.S., by comparison, were 2.6 percent and 1.9 percent, respectively (Exhibit 6).
Exhibit 6: Percentage Change in Real Gross Domestic Product, Manufacturing, 2009 to 2019 (Indexed to 2009)
| Year | Northwest Region | Texas | USA |
|---|---|---|---|
| 2009 | 0.0% | 0.0% | 0.0% |
| 2010 | -1.2% | 10.8% | 5.4% |
| 2011 | 8.1% | 15.0% | 5.8% |
| 2012 | 3.2% | 10.9% | 5.1% |
| 2013 | 9.5% | 23.3% | 8.3% |
| 2014 | 10.7% | 11.3% | 10.2% |
| 2015 | 8.6% | 15.0% | 11.7% |
| 2016 | 6.7% | 11.7% | 10.9% |
| 2017 | 13.5% | 18.2% | 13.7% |
| 2018 | 21.4% | 24.4% | 18.5% |
| 2019 | 23.5% | 29.7% | 20.8% |
Note: Due to GDP data withheld to avoid disclosure of confidential information, the analysis excludes the Northwest Region counties of Baylor, Cottle, Fisher, Foard, Hardeman, Haskell, Knox, Mitchell, Shackelford, Stonewall and Throckmorton.
Sources: U.S Bureau of Economic Analysis and Texas Comptroller of Public Accounts
Pandemic Effects
All Texas industry sectors have been affected by the pandemic to some degree, and manufacturing is no exception. Monthly jobs data show that manufacturing jobs in the Wichita Falls metropolitan area fell by 700 (or -13.5 percent) in February 2021 compared to the previous year. This decrease exceeds manufacturing job declines in Texas (-6.0 percent) and the U.S. (-4.1 percent) in this period. Manufacturing jobs in the Abilene MSA remained unchanged in this period (Exhibit 7).
Exhibit 7: Changes in Manufacturing Jobs, February 2020 to February 2021
| Metro Area | Manufacturing Jobs | Percent Change (Manufacturing) | Percent Change (Total Employment) |
|---|---|---|---|
| Abilene MSA | 0 | 0.0% | -4.4% |
| Wichita Falls MSA | -700 | -13.5% | -4.8% |
| Texas | -54,200 | -6.0% | -4.6% |
| United States | -524,000 | -4.1% | -6.0% |
Source: Texas Workforce Commission
Note: Not seasonally adjusted
Key Manufacturing Industries
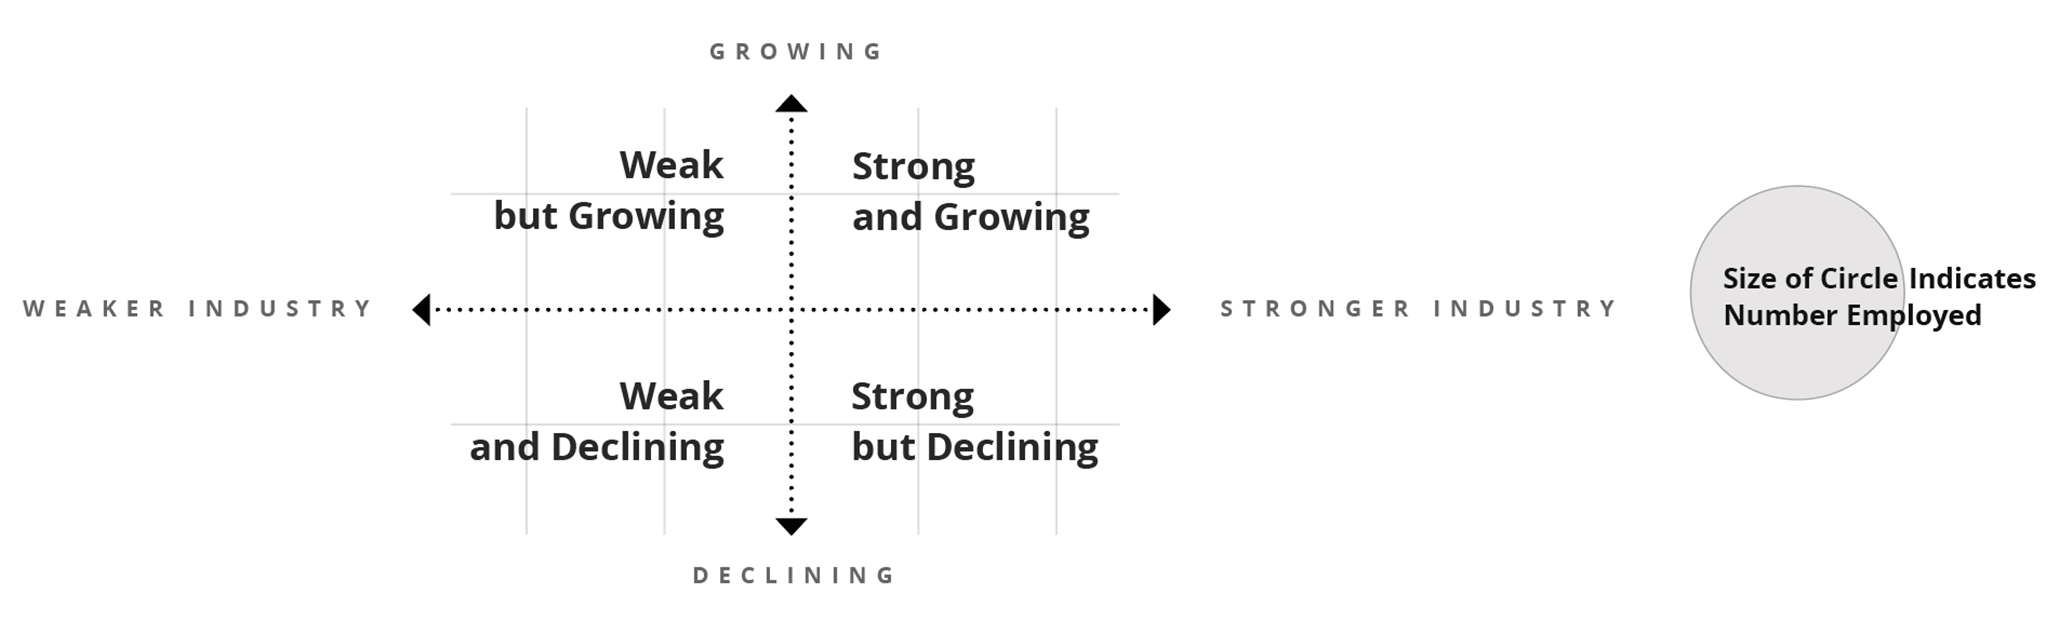
The interactive exhibit (Exhibit 8) displays regional manufacturing industry strengths and weaknesses through the use of two common analytical tools that compare regional manufacturing employment trends to national averages. These tools serve as an educational resource to assess industry strengths and inform development prospects.
First, the location quotient (LQ) measures state and regional industry concentration levels by comparing an industry’s share of total regional employment to its share of total national employment. If the regional industry share exceeds the national share (an LQ greater than 1.00), the industry is more “concentrated” in the region than nationally. A score above 1.00 may indicate that the regional industry is strong and self-sufficient and that it exports its products or services outside of the region. Regional industries with below-average employment concentrations (LQs of less than 1.00) often import goods or services from other areas.
A second tool, shift-share analysis (SSA), measures regional industry employment changes and assesses the role of local competitiveness on gains or losses. The SSA uses national employment and industry trends to produce expected employment changes for a regional industry. If a regional industry’s actual employment changes exceed expected changes (a positive local competitiveness effect), the region may have a productive advantage in the industry.
The Northwest Region’s manufacturing industries plotted in the exhibit fall into one of four quadrants based on 2019 LQ values and SSA values between 2009 and 2019:
- Strong and growing: Industry has above-average concentration levels (2019 LQ value > 1.00) and industry job changes exceeded expected changes between 2009 and 2019 (positive competitiveness effect);
- Strong but declining: Industry has above-average concentration levels (2019 LQ value > 1.00) and industry job changes fell below expected changes between 2009 and 2019 (negative competitiveness effect);
- Weak but growing: Industry has below-average concentration levels (2019 LQ value < 1.00) and industry job changes exceeded expected changes between 2009 and 2019 (positive competitiveness effect); and
- Weak and declining: Industry has below-average concentration levels (2019 LQ value < 1.00) and industry job changes fell below expected changes between 2009 and 2019 (negative competitiveness effect).
The region’s leather products industry is its most heavily concentrated manufacturing industry, with an LQ value of 5.29. (In other words, the industry’s share of Northwest Region employment is 5.29 times higher than the industry’s nationwide share.) Other heavily concentrated regional industries include nonmetallic minerals, aerospace products, plastics and rubber products, and primary metals.
While regional manufacturing jobs did rise slightly between 2009 and 2019, SSA shows that manufacturing employment in the Northwest Region fell short of expected changes by an estimated 1,401 jobs. Several regional industries, however, did surpass expected changes, led by the electrical equipment, appliance and component manufacturing industry, which exceeded expected gains by 487 jobs.
Four industries – fabricated metal products, aerospace products and parts, nonmetallic mineral products and food manufacturing – accounted for over half of the Northwest Region’s manufacturing jobs; together, they comprised 52.7 percent of those jobs in 2019 and 54.6 percent of the region’s total manufacturing wages.
A note of caution: A positive competitive effect indicates that some economic advantages exist in a region – such as access to natural resources or to a more productive labor pool, management or technologies – but it can’t identify the source of that advantage through SSA.
Exhibit 8: Manufacturing Industries in the Northwest Region, Concentration Levels and Competitiveness
| Industry Title | NAICS | Employment, 2019 | Location Quotient, 2019 | Employment Changes due to Local Competitiveness, 2009-2019 |
|---|---|---|---|---|
| Food Manufacturing | 311 | 2,131 | 0.89 | -239 |
| Beverage and Tobacco Product Manufacturing | 312 | 352 | 0.83 | -125 |
| Textile Mills | 313 | 13 | 0.08 | -103 |
| Textile Product Mills | 314 | 203 | 1.23 | -51 |
| Apparel Manufacturing | 315 | 282 | 1.77 | 154 |
| Leather and Allied Product Manufacturing | 316 | 213 | 5.29 | 76 |
| Wood Product Manufacturing | 321 | 258 | 0.43 | -331 |
| Paper Manufacturing | 322 | 524 | 0.98 | -67 |
| Printing and Related Support Activities | 323 | 209 | 0.33 | -70 |
| Petroleum and Coal Products Manufacturing | 324 | 79 | 0.47 | -83 |
| Chemical Manufacturing (Resource-Intensive Commodities) | 3251-3253 | 352 | 0.85 | 91 |
| Pharmaceutical and Medicine Manufacturing | 3254 | 15 | 0.03 | -10 |
| Chemical Manufacturing (Locally Processed Goods) | 3255-3259 | 106 | 0.28 | 18 |
| Plastics and Rubber Products Manufacturing | 326 | 1,810 | 1.69 | -166 |
| Nonmetallic Mineral Product Manufacturing | 327 | 2,285 | 3.73 | -190 |
| Primary Metal Manufacturing | 331 | 827 | 1.46 | -283 |
| Fabricated Metal Product Manufacturing | 332 | 2,657 | 1.22 | 78 |
| Machinery Manufacturing | 333 | 1,029 | 0.62 | 63 |
| Computer and Electronic Product Manufacturing | 334 | 462 | 0.29 | -158 |
| Electrical Equipment, Appliance, and Component Manufacturing | 335 | 768 | 1.30 | 487 |
| Motor Vehicle, Body, and Parts Manufacturing | 3361-3363 | 303 | 0.21 | -89 |
| Aerospace Product and Parts Manufacturing | 3364 | 2,239 | 2.85 | -170 |
| Other Transportation Equipment Manufacturing | 3365-3369 | 158 | 0.45 | 22 |
| Furniture and Related Product Manufacturing | 337 | 225 | 0.40 | -177 |
| Medical Equipment and Supplies Manufacturing | 3391 | 27 | 0.06 | -77 |
| Other Miscellaneous Manufacturing | 3399 | 140 | 0.33 | -1 |
| Total - Manufacturing | 17,668 | 0.94 | -1,401 |
Sources: JobsEQ and Texas Comptroller of Public Accounts
Summary
Although the Texas population increased by 15.3 percent during the past 10 years, the Northwest Region’s population was stagnant during this period and represents less than 2 percent of the state total. Similarly, the region’s manufacturing industry has not seen a lot of growth, but encouraging developments in certain industries have stabilized the overall manufacturing outlook.