The beverage and tobacco subsector rose by 36 percent from 2010 to 2016, easily the largest percent growth among all Texas manufacturing subsectors.
Skip navigation

Top navigation skipped
Food and Beverage and Tobacco Product Manufacturing
The food manufacturing (NAICS 311) and beverage and tobacco product manufacturing (NAICS 312) subsectors include businesses providing a variety of products such as meats, specialty foods, baked goods, packaged fruits and vegetables, teas, coffees, beers and wines. Food manufacturing also includes the refiners of raw food materials such as rice, flour, corn and sugar.
169,250
Direct & Indirect Employment
$15.1 Billion
State Subsector GDP
$56,199
Average Annual Wage
$5.5 Billion
Exports
Sources: U.S. Bureau of Economic Analysis, Regional Economic Models, Inc., Emsi, U.S. Department of Commerce International Trade Administration
Largest Industries in Food and Beverage and Tobacco Product Manufacturing, 2016
Animal slaughterers are the largest food and beverage manufacturers in Texas, followed by poultry processing. Among the largest industries, animal slaughterers, soft drinks makers and tortilla manufacturers have location quotients above 1.00, meaning their statewide shares of employment are above the national averages, possibly indicating exporting industries.
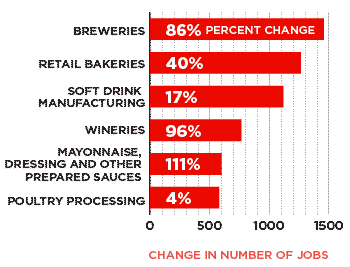
Largest Job Gains By Industry, 2010 to 2016
Beverage manufacturers were among the largest job gainers from 2010 to 2016, including breweries, soft drink makers and wineries.
| Description | Job Change | 2010 to 2016 Percent Change |
|---|---|---|
| Breweries | 1,459 | 86% |
| Retail Bakeries | 1,267 | 40% |
| Soft Drink Manufacturing | 1,119 | 17% |
| Wineries | 767 | 96% |
| Mayonnaise, Dressing and Other Prepared Sauce Manufacturing | 603 | 111% |
| Poultry Processing | 581 | 4% |
| Description | Direct Jobs 2016 | Average Texas Salaries 2016 | Location Quotient 2016* |
|---|---|---|---|
| Animal Slaughtering (except poultry) | 14,216 | 40,688 | 1.27 |
| Poultry Processing | 13,822 | 32,881 | 0.73 |
| Commercial Bakeries | 8,589 | 45,466 | 0.77 |
| Meat Processed from Carcasses | 8,068 | 41,687 | 0.8 |
| Soft Drink Manufacturing | 7,895 | 57,482 | 1.18 |
| Frozen Specialty Food Manufacturing | 4,521 | 38,186 | 0.95 |
| Retail Bakeries | 4,429 | 24,115 | 0.64 |
| Tortilla Manufacturing | 3,461 | 29,385 | 2.18 |
| Breweries | 3,157 | 67,002 | 0.65 |
*Location quotient compares an industry’s share of jobs in a specific region with its share of nationwide employment. Source: Emsi
Subsector and Industry Concentration in Texas
Due to its size and regional diversity, Texas produces a wide variety of food and beverage products, including beef in the High Plains, poultry in Upper East Texas, rice in the Southeast and tortillas in the South region.
- High Plains Region LQ 3.15
- Dumas: Animal Slaughtering (except poultry)
- Hereford: Flour Milling
- Plainview: Animal Slaughtering (except poultry)
- Upper East Region LQ 1.72
- Paris: Specialty Canning
- Southeast Region LQ 1.26
- Nacogdoches: Poultry Manufacturing, Soft Drink Manufacturing
- Beaumont-Port Arthur: Rice Milling
- Central LQ 1.23
- Waco: Poultry Manufacturing, Soft Drink Manufacturing
- Brenham: Ice Cream and Frozen Dessert
Sources: Emsi, Texas Comptroller of Public Accounts
Conclusion
Manufacturing continues to drive output and productivity in the Texas economy, creating jobs paying well above the statewide average. It also contributes significantly to job creation in other industries, particularly in design operations and services.
Texas manufactures a variety of food and beverage products across its diverse regions, as producers respond to local demand and local tastes. Proximity to raw materials and supply networks also are highly important to ensure the freshness of its products.