Texas exports in this subsector rose from $2.6 billion in 2009 to $4.8 billion in 2016, an 85 percent gain. This increase outpaced total Texas export growth of 42 percent during this period.
Skip navigation

Top navigation skipped
Plastics and Rubber Products Manufacturing
This subsector manufactures a variety of intermediate and final products by processing plastics material and raw rubber. Plastic products include plastic films, sheets, bags, pipes and pipe fittings, laminates, foam products and bottles, as well as plumbing fixtures.
Rubber products include tires, inner tubes and rubber hoses and belting. In Texas, the subsector employment rose by just one percent from 2010 to 2016, compared to a 12 percent increase nationwide.
47,600
Direct & Indirect Employment
$4.9 Billion
State Subsector GDP
$52,100
Average Annual Wage
$4.8 Billion
Exports
Sources: U.S. Bureau of Economic Analysis, Regional Economic Models, Inc., Emsi, U.S. Department of Commerce International Trade Administration
INDUSTRIES IN THE PLASTICS AND RUBBER PRODUCTS MANUFACTURING SUBSECTOR
This subsector’s share of Texas employment is 45 percent lower than its share of national employment, indicating that it is not specialized in Texas.
Some areas in Texas, however, do have a high share of subsector employment, as measured by location quotient (LQ), a comparison of an industry’s share of jobs in a specific region with its share of nationwide employment. Using this gauge, the Northwest region’s concentration of employment in the subsector is nearly twice as high as in the U.S. as a whole.
| Description | Direct Jobs 2016 | Job Change 2010 to 2016 | Average Texas Salaries 2016 | Location Quotient 2016 |
|---|---|---|---|---|
| Subsector Totals | 37,650 | 1.2% | $52,096 | 0.65 |
| Plastics Products | 34,172 | 4.3% | $51,684 | 0.73 |
| Rubber Products | 3,478 | -22.0% | $56,145 | 0.31 |
Source: Emsi
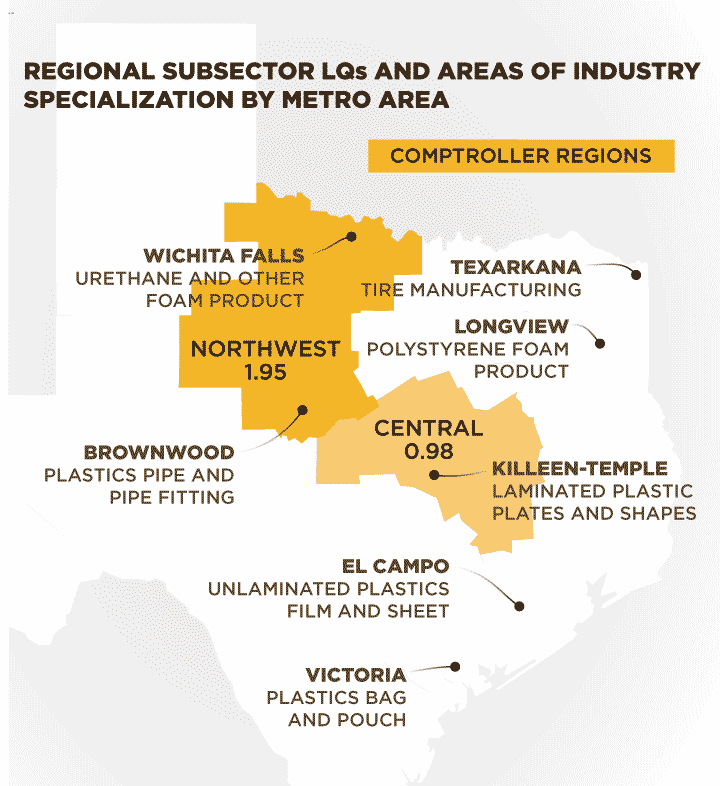
Regional Subsector LQs and Areas of Industry Specialization by Metro Area
- Northwest Region LQ 1.95
- Brownwood: Plastics Pipe and Pipe Fittings
- Wichita Falls: Urethane and other foam products
- Central Region LQ 0.98
- Kileen-Temple: Laminated Plastic Plates and Shapes
- Other Regions:
- Texarkana: Tire Manufacturing
- Longview: Polystyrene Foam Products
- El Campo: Unlaminated Plastics Film and Sheet
- Victoria: Plastics Bag and Pouch
Sources: Emsi, Texas Comptroller of Public Accounts
Subsector Exports
Texas exports to Mexico accounted for nearly 80 percent of total subsector exports. Export values to Mexico rose 102 percent from $1.9 billion in 2009, to $3.8 billion in 2016.
Source: U.S. Department of Commerce International Trade Administration
Source: U.S. Department of Commerce International Trade Administration
Conclusion
Manufacturing continues to drive output and productivity in the Texas economy, creating jobs paying well above the statewide average. It also contributes significantly to job creation in other industries, particularly in services.
The plastics and rubber products subsector remains less concentrated in Texas than in the U.S. overall. But the subsector’s GDP growth in Texas has outperformed that of the U.S. subsector, and export growth since 2009 is strong, especially to Mexico.