More than 60 million tons of steel are recycled or exported for recycling each year in North America alone.
Skip navigation

Top navigation skipped
Primary Metals Manufac-turing
Primary metals manufacturing includes mills and foundries that make a variety of upstream metal products such as closures, castings, pipes, tubes, wires and springs. Demand for primary metals stems from the industries that rely on them, including the automotive, energy, machinery and transportation industries. Other major operational considerations include access to raw materials and the costs of energy inputs and transportation.
69,500
Direct & Indirect Employment
$3.1 Billion
State Subsector GDP
$57,500
Average Annual Wage
$4.6 Billion
Exports
Sources: U.S. Bureau of Economic Analysis, Regional Economic Models, Inc., Emsi, U.S. Department of Commerce International Trade Administration
Advanced Industries
Some industries in the primary metals subsector are considered “advanced” as defined by the Brookings Institution — their research and development spending per worker ranks in the top 20 percent of industries and their share of workers with high levels of scientific and technical knowledge exceeds the national average.
Source: American Iron and Steel Institute
| Description | Direct Jobs 2016 | Job Change 2010-2016 | Average Texas Salaries 2016 | Location Quotient 2016 |
|---|---|---|---|---|
| Subsector Totals | 20,159 | 2.1% | $57,532 | 0.65 |
| Iron and Steel Mills and Ferroalloy Manufacturing | 4,777 | 14.9% | $60,262 | 0.70 |
| Steel Product Manufacturing from Purchased Steel | 4,140 | 10.3% | $61,114 | 0.89 |
| Alumina and Aluminum Production and Processing | 3,529 | -15.4% | $57,925 | 0.73 |
| Nonferrous Metal (except Aluminum) Production and Processing | 3,791 | 29.6% | $59,787 | 0.76 |
| Foundries | 3,922 | -17.3% | $47,891 | 0.40 |
Source: Emsi
REGIONAL SUBSECTOR LQs AND AREAS OF INDUSTRY SPECIALIZATION BY METRO AREA
Location quotient (LQ) compares an industry’s share of jobs in a specific region with its share of nationwide employment.
The Northwest, Upper East and Upper Rio Grande regions have the highest concentration of primary metal employment in Texas. The share of subsector employment in the Northwest region is about 70 percent higher than in the U.S. as a whole.
Sources: Emsi, Texas Comptroller of Public Accounts
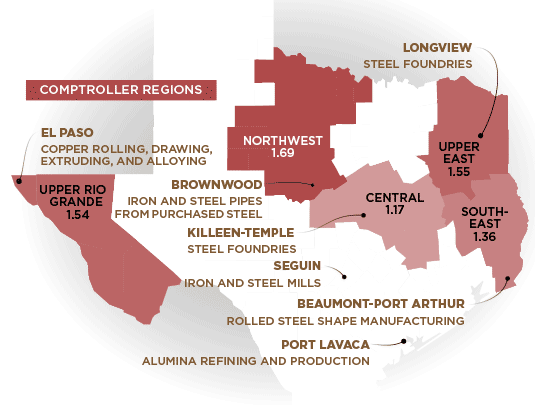
- Northwest Region LQ 1.69
- Brownwood: Iron and Steel Pipes from Purchased Steel.
- Upper East Region LQ < 1.55
- Longview: Steel Foundries
- Central Region LQ 1.17
- Killeen-Temple: Steel Foundries
- Southeast Region LQ 1.54
- El Paso: Copper Rolling, Drawing, Extruding and Alloying
- Upper Rio Grande Region LQ 1.36
- Beaumont-Port Arthur: Rolled Steel and Shape Manufacturing
- Other Regions LQ < 1
- Seguin: Iron and Steel Mills
- Port Lavaca: Alumina Refining and Production
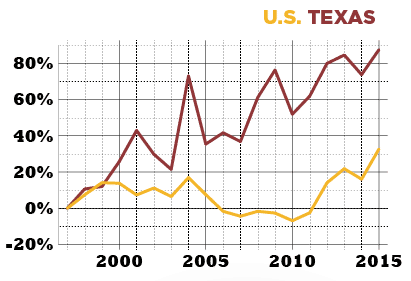
TEXAS REAL GDP OUTPACES U.S. GROWTH
Sources: U.S. Bureau of Economic Analysis and Texas Comptroller of Public Accounts
| Year | U.S. | Texas |
|---|---|---|
| 1997 | 0% | 0% |
| 1998 | 7% | 11% |
| 1999 | 14% | 12% |
| 2000 | 14% | 26% |
| 2001 | 7% | 43% |
| 2002 | 11% | 30% |
| 2003 | 7% | 21% |
| 2004 | 17% | 73% |
| 2005 | 8% | 35% |
| 2006 | -2% | 42% |
| 2007 | -4% | 37% |
| 2008 | -2% | 61% |
| 2009 | -3% | 76% |
| 2010 | -7% | 52% |
| 2011 | -2% | 62% |
| 2012 | 14% | 80% |
| 2013 | 22% | 85% |
| 2014 | 16% | 74% |
| 2015 | 33% | 87% |
The state’s primary metals manufacturing GDP rose by an inflation-adjusted 87 percent from 1997 through 2015, compared to 33 percent nationwide.
Conclusion
Manufacturing continues to drive output and productivity in the Texas economy, creating jobs paying well above the statewide average. It also contributes significantly to job creation in other industries, particularly in design operations and services.
The primary metals subsector faces economic transitions that will affect demand levels, including reduced use of steel in the automotive market as carmakers strive to produce lighter, more fuel-efficient vehicles and a shift toward increased recycling and reuse of steel. However, the subsector’s employment in Texas rose by 2.1 percent from 2010 through 2016, led by job gains in nonferrous metal production, which increased employment by nearly 30 percent during this period.