Skip navigation

Top navigation skipped
Regional Job Changes,
Furniture and Related Product Manufacturing
This subsector includes products for households and offices, such as mattresses, blinds and shades, kitchen cabinets, countertops and parts and frames. The most common materials for production are metal, wood, plastic and textiles. Businesses in this subsector may combine design processes for their products.
23,142
Direct & Indirect Employment
$1.4 Billion
State Subsector GDP
$41,559
Average Annual Wage
$578 Million
Exports
Sources: U.S. Bureau of Economic Analysis, Regional Economic Models, Inc., Emsi, U.S. Department of Commerce International Trade Administration
Industries in Furniture Manufacturing Subsector
One method to measure a subsector’s regional strength is the location quotient (LQ), a ratio of the subsector’s share of employment in a region to its share of employment in the U.S. as a whole; the higher the LQ value, the more “concentrated” the industry.
LQ values often are used to identify regional strengths and inform economic development and investment decisions.
Texas’ statewide 0.72 LQ in furniture and related product manufacturing indicates the subsector is not highly competitive. The only industry within the subsector with an LQ above 1.00 is the “Other Furniture Related Product Manufacturing.”
| Description | Direct Jobs 2016 | Average Texas Salaries 2016 | Location Quotient 2016 |
|---|---|---|---|
| Subsector Totals | 23,142 | $41,559 | 0.72 |
| Household and Institutional Furniture and Kitchen Cabinet Manufacturing | 15,157 | $40,907 | 0.74 |
| Office Furniture (including Fixtures) Manufacturing | 4,321 | $45,673 | 0.49 |
| Other Furniture Related Product Manufacturing | 3,664 | $39,406 | 1.18 |
Source: Emsi
Regional subsector LQs and Areas of Industry Specialization by metro area
A regional assessment of employment concentration is useful as the size of Texas’ economy and workforce can obscure regional industry strengths. The furniture and related product manufacturing subsector does have above-average employment concentrations in Texas’ Central, Upper East and Metroplex regions.
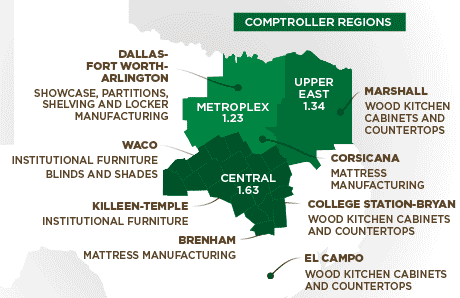
- Upper East Region LQ 1.34
- Marshall: Wood Kitchen Cabinets and Countertops
- Central LQ 1.63
- Waco: Institutional Furniture, Blinds and Shades
- Brenham: Mattress Manufacturing
- Killeen-Temple: Institutional Furniture
- College Station: Wood Kitchen Cabinets and Countertops
- Metroplex LQ 1.23
- Dallas - Fort Worth - Arlington: Showcase, Partitions, Shelving and Locker Manufacturing
- Corsicana: Mattress Manufacturing
- Other LQ < 1
- El Campo: Wood Kitchen Cabinets and Countertops
Sources: Emsi, Texas Comptroller of Public Accounts
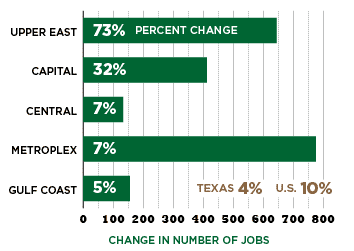
Regional Job Changes,
2010 to 2016
Texas subsector jobs rose by 4 percent from 2010 to 2016, compared to 10 percent in the U.S.
Texas’ Upper East region experienced the largest percent growth, at 73 percent; the Metroplex region added the most total jobs.
| Region | Job Change | 2010 to 2016 Percent Change |
|---|---|---|
| Upper East | 1,530 | 73% |
| Capital | 1,710 | 32% |
| Central | 2,115 | 7% |
| Metroplex | 11,621 | 7% |
| Gulf Coast | 3,105 | 5% |
| Texas | 23,142 | 4% |
| U.S. | N/A | 10% |
Conclusion
Manufacturing continues to drive output and productivity in the Texas economy, creating jobs paying well above the statewide average. It also contributes significantly to job creation in other industries, particularly in design operations and services.
The furniture and related product subsector is likely to benefit from rising home sales and housing starts. It will, however, continue to contend with import competition as well as demographic and societal shifts, including a move to smaller and multi-purpose items to accommodate renters and single-person households. Demand for home office furniture also is increasing as more workers telecommute.