In Texas, this subsector’s inflation-adjusted GDP rose by 60 percent between 1997 and 2015, compared to U.S. growth of 20 percent.
Skip navigation

Top navigation skipped
Chemical Product Manufacturing
This manufacturing subsector creates products essential to our daily needs, such as household cleaning products, beauty products, pharmaceuticals and diagnostic substances, agricultural fertilizers, dyes and paints, adhesives, plastics and much more. As this subsector is tied to many end-use consumer products, its health is highly dependent on global economic growth and an economically stable middle class.
321,000
Direct & Indirect Employment
$55.5 Billion
State Subsector GDP
$108,000
Average Annual Wage
$36.6 Billion
Exports
Sources: U.S. Bureau of Economic Analysis, Regional Economic Models, Inc., Emsi, U.S. Department of Commerce International Trade Administration
CHEMICAL PRODUCT MANUFACTURING: BIG IN TEXAS
The basic chemical manufacturing industry — such as petrochemicals, industrial gas and ethyl alcohol — is highly concentrated in Texas. Its share of total employment is 2.87 times greater in Texas than in the U.S. In 2016, 67 percent of all U.S. petrochemical production jobs were in Texas. Such levels of employment concentration can indicate a regional “industry cluster.”
Sources: U.S. Bureau of Economic Analysis
| Description | Direct Jobs 2016 | Job Change 2010-2016 | Average Texas Salaries 2016 | Location Quotient 2016 |
|---|---|---|---|---|
| Subsector Totals | 78,845 | 12% | $108,397 | 1.17 |
| Basic Chemicals | 35,376 | 14% | $123,588 | 2.87 |
| Resin, Synthetic Rubber, and Artificial Synthetic Fibers and Filaments | 10,242 | 22% | $119,391 | 1.32 |
| Pesticide, Fertilizer, and Other Agricultural Chemicals | 2,872 | -4% | $85,120 | 0.97 |
| Pharmaceutical and Medicine | 11,502 | 20% | $103,186 | 0.49 |
| Paint, Coating, and Adhesives | 5,765 | 8% | $77,775 | 1.13 |
| Soap, Cleaning Compounds, and Toilet Preparation Manufacturing | 4,272 | -15% | $67,282 | 0.49 |
| Other Chemical Products and Preparation | 8,817 | 11% | $89,002 | 1.31 |
Source: Emsi
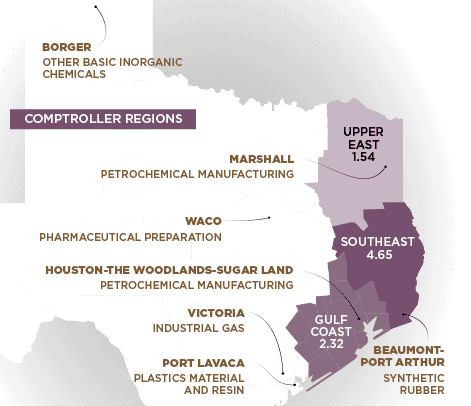
REGIONAL SUBSECTOR LQs AND AREAS OF INDUSTRY SPECIALIZATION BY METRO AREA
Location quotient (LQ) compares an industry’s share of jobs in a specific region with its share of nationwide employment.
In Southeast Texas, chemical manufacturing employment is more than 4.5 times higher than its nationwide share.
Sources: Emsi, Texas Comptroller of Public Accounts
- Upper East Region LQ < 1.54
- Marshall: Petrochemical Manufacturing
- Southeast Region LQ 4.65
- Beaumont, Port Arthur: Synthetic Rubber
- Gulf Coast Region LQ 2.32
- Houston, The Woodlands, Sugar Land: Petrochemical Manufacturing
- Other Regions
- Borger: Other Basic Inorganic Chemicals
- Waco: Pharmaceutical Preparation
- Victoria: Industrial Gas
- Port Lavaca: Plastics Material and Resin
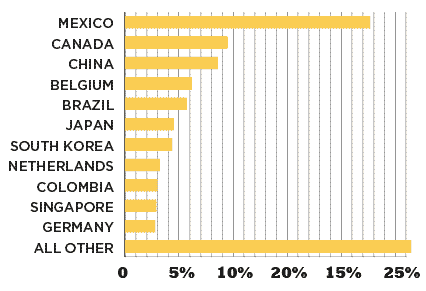
SUBSECTOR EXPORTS FROM TEXAS
| Trade Partner | 2016 Share |
|---|---|
| Mexico | 22.7% |
| Canada | 9.5% |
| China | 8.6% |
| Belgium | 6.2% |
| Brazil | 5.7% |
| Japan | 4.5% |
| South Korea | 4.4% |
| Netherlands | 3.2% |
| Columbia | 3.0% |
| Singapore | 2.9% |
| Germany | 2.8% |
| All Other | 26.5% |
Sources: Source: U.S. Department of Commerce International Trade Administration
Texas exported $36.6 billion in chemical products in 2016, making this subsector the state’s second-largest export market behind computer and electronic parts.
Conclusion
Chemical product manufacturing contributes $55.5 billion to Texas’ GDP, the greatest amount of any manufacturing subsector. Industries in chemical manufacturing have experienced increased production, profits and employment in recent years, fueled by lower costs of natural gas, the main feedstock of Texas chemical plants. Chemical manufacturing employment has remained stable since early 2015, alleviating the effects of job losses in other manufacturing subsectors caused by declining crude oil prices.