Texas manufacturing accounted for 10 percent of U.S. manufacturing GDP in 2016.
Skip navigation

Top navigation skipped
Texas Manufacturing Snapshot
Statewide Manufacturing Overview »
Texas has an extraordinary manufacturing economy. The state’s resources make it a natural leader in petroleum and chemical manufacturing; its research institutions have fostered computer-related and other high-tech manufacturing; and a business-friendly environment and skilled labor have helped create a burgeoning automotive manufacturing sector.
IN ALL, MANUFACTURING CONTRIBUTED $218 BILLION TO TEXAS’ GROSS DOMESTIC PRODUCT (GDP) in 2016, an amount larger than the entire economy of Portugal.
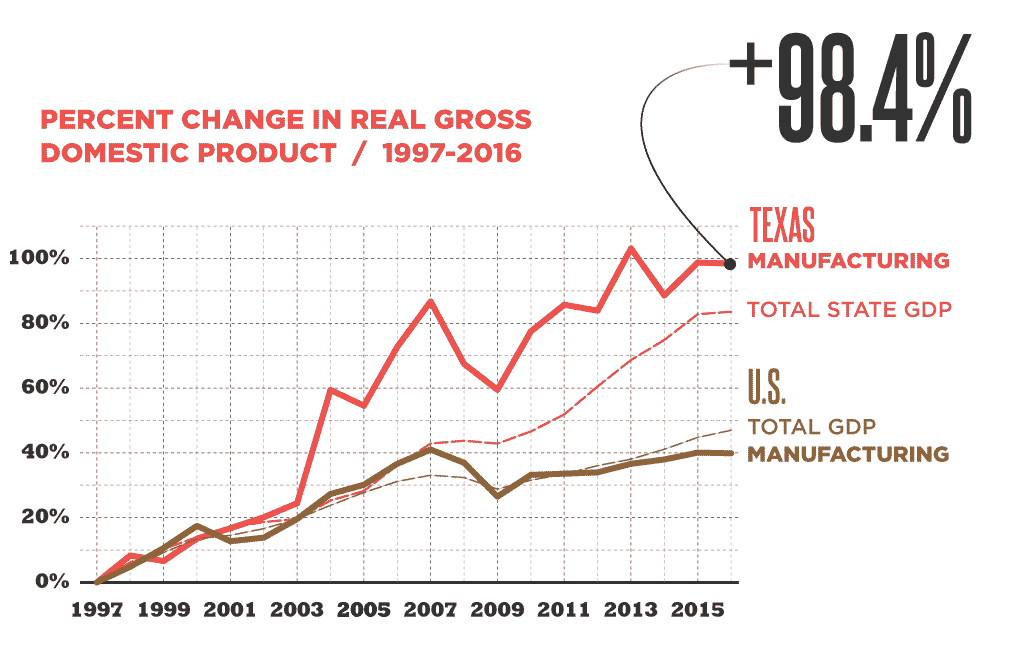
While Texas’ manufacturing employment has diminished as a result of automation, technological advances and other factors, its economic output has increased. From 1997 through 2016, Texas’ manufacturing job count fell by 19 percent, but its real GDP rose by 94 percent.
Texas has 845,000 DIRECT MANUFACTURING JOBS, as well as another 2.2 MILLION JOBS indirectly created or supported by manufacturers. In 2016, average annual Texas wages in manufacturing approached $73,000, much higher than the statewide average of $53,500.
3,000,000
Direct & Indirect Employment
$218.3 Billion
Texas Manufacturing GDP
$73,100
Average Annual Wage
$208.7 Billion
Exports
Sources: U.S. Bureau of Economic Analysis, Regional Economic Models, Inc., Emsi, U.S. Department of Commerce International Trade Administration
Percent Change in Real Gross Domestic Product and Employment
| Year | US Total | US Manufacturing | Texas Total | Texas Manufacturing |
|---|---|---|---|---|
| 1997 | 0.0% | 0.0% | 0.0% | 0.0% |
| 1998 | 4.3% | 4.8% | 6.2% | 8.3% |
| 1999 | 9.2% | 10.6% | 10.3% | 6.6% |
| 2000 | 13.5% | 17.4% | 14.0% | 13.5% |
| 2001 | 14.5% | 12.7% | 16.9% | 16.7% |
| 2002 | 16.6% | 13.8% | 18.6% | 20.1% |
| 2003 | 19.6% | 19.6% | 19.6% | 24.5% |
| 2004 | 23.8% | 27.3% | 25.3% | 59.4% |
| 2005 | 27.7% | 30.2% | 28.2% | 54.5% |
| 2006 | 31.2% | 36.6% | 36.2% | 72.7% |
| 2007 | 33.1% | 41.0% | 42.9% | 86.7% |
| 2008 | 32.4% | 36.9% | 43.7% | 67.5% |
| 2009 | 28.8% | 26.5% | 42.9% | 59.5% |
| 2010 | 31.6% | 33.2% | 46.6% | 77.5% |
| 2011 | 33.4% | 33.6% | 51.9% | 85.7% |
| 2012 | 36.0% | 34.0% | 60.5% | 83.9% |
| 2013 | 38.0% | 36.6% | 68.6% | 103.1% |
| 2014 | 41.4% | 38.7% | 74.5% | 89.0% |
| 2015 | 45.2% | 39.9% | 81.8% | 94.8% |
| 2016 | 47.4% | 40.6% | 81.3% | 93.9% |
Sources: U.S. Bureau of Economic Analysis, U.S. Bureau of Labor Statistics
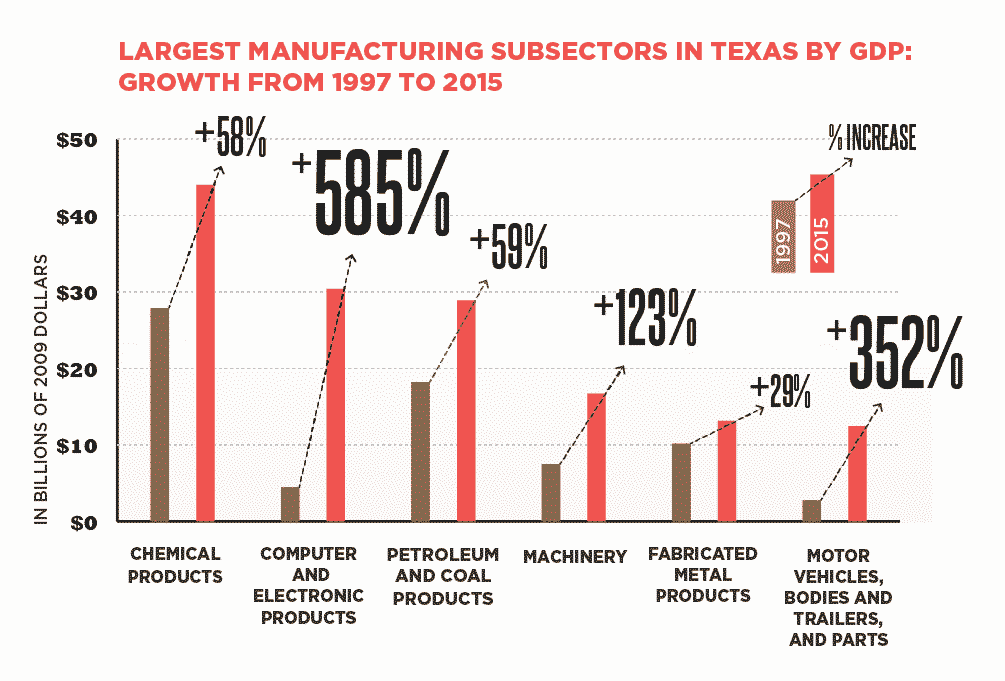
Largest Manufacturing Subsectors in Texas by GDP: Growth from 1997 to 2015
| Subsector | 1997 Real GDP (in Billions) | 2015 Real GDP (in Billions) | Percent Change in GDP |
|---|---|---|---|
| Chemical products manufacturing | $27.894 | $44.001 | 58% |
| Computer and electronic products manufacturing | $4.441 | $30.403 | 585% |
| Motor vehicles, bodies and trailers, and parts manufacturing | $2.752 | $12.451 | 352% |
| Machinery manufacturing | $7.504 | $16.709 | 123% |
| Fabricated metal products | $10.173 | $13.149 | 29% |
| Aerospace and other transportation equipment manufacturing | $5.381 | $9.939 | 85% |
| Primary metals manufacturing | $1.639 | $3.026 | 85% |
| Petroleum and coal products manufacturing | $18.211 | $28.913 | 59% |
| Motor vehicles, bodies and trailers, and parts manufacturing | $2.752 | $12.451 | 352% |
*GDP values inflation-adjusted to 2009 dollars.
Note: GDP data for subsectors are only available through 2015
TEXAS MANUFACTURING OUTPUT HAS OUTPACED THE TOTAL TEXAS ECONOMY.
From 1997 through 2016, growth in Texas manufacturers’ economic output more than doubled U.S. manufacturing gains of 41 percent.
Between 1997 and 2016, manufacturing real GDP increased 94 percent, compared with an 81 percent gain across all Texas industries.
Sources: U.S. Bureau of Economic Analysis, Texas Comptroller of Public Accounts