This subsector includes “advanced industries ” meaning their R&D spending is in the top 20 percent of all industries and their share of STEM workers exceeds the national average.
Skip navigation

Top navigation skipped
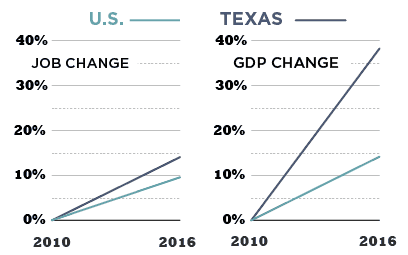
TEXAS SUBSECTOR OUTPERFORMS
Nonmetallic Mineral Product Manufacturing
Using minerals such as sand, stone, clay and refractory materials (substances that can withstand high temperatures), this subsector manufactures a variety of products – heavy construction components, glass, clay and ceramic tiles and household accessories. In Texas, this subsector’s employment rose by 30 percent in the 1990s, peaking at 45,100 jobs in 2001. Its job count declined following the Great Recession in 2008 but has recovered slightly since, and remains nearly 9 percent above 1990 levels.
78,200
Direct & Indirect Employment
$5.3 Billion
State Subsector GDP
$58,000
Average Annual Wage
$765 Million
Exports
Sources: U.S. Bureau of Economic Analysis, Regional Economic Models, Inc., Emsi, U.S. Department of Commerce International Trade Administration
INDUSTRIES IN SUBSECTOR ENJOY COMPETITIVE ADVANTAGE IN TEXAS
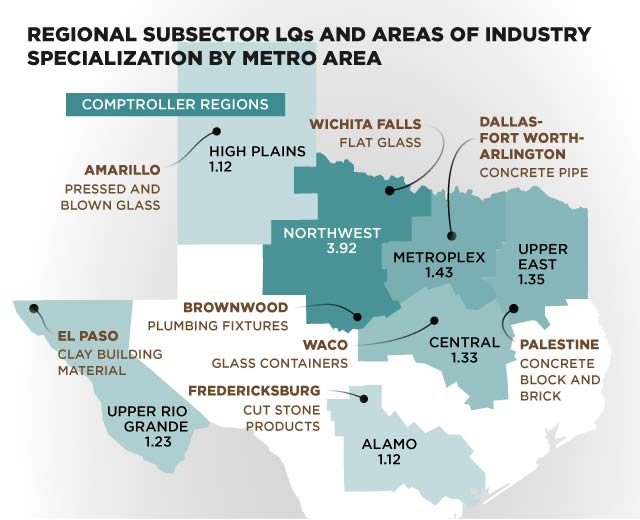
This subsector’s share of employment is higher than the national average in many regions of Texas, as gauged by the location quotient (LQ), a measure comparingan industry’s share of jobs in a specified region with its share of nationwide employment. A high LQ suggests a competitive advantage and the existence of a regional industry cluster, a group of interrelated firms in an area that provide related products or services and share similar needs for workers and suppliers.
The Northwest region had the highest LQ value of 3.92, meaning the share of jobs in the region is nearly four times higher than the national average.
| Description | Direct Jobs 2016 | Job Change 2010 to 2016 | Average Texas Salaries 2016 | Location Quotient 2016 |
|---|---|---|---|---|
| Subsector Totals | 37,586 | 14.1% | $57,956 | 1.12 |
| Clay Products and Refractory | 5,102 | 4.3% | $55,709 | 1.56 |
| Glass and Glass Products | 3,579 | 17.4% | $57,556 | 0.51 |
| Cement and Concrete Products | 21,426 | 18.5% | $60,245 | 1.37 |
| Lime and Gypsum Products | 1,302 | -0.9% | $60,835 | 1.09 |
| Other Nonmetallic Mineral Products | 6,176 | 10.2% | $51,497 | 0.98 |
Source: Emsi
Regional Subsector LQs and Areas of Industry Specialization by Metro Area
- High Plains Region LQ 1.12
- Amarillo: Pressed and Blown Glass
- Northwest Region LQ 3.92
- Wichita Falls: Flat Glass
- Brownwood: Plumbing Fixtures
- Metroplex Region LQ 1.43
- Dallas-Fort Worth-Arlington: Concrete Pipe
- Upper East Region LQ 1.35
- Palestine: Concrete Block and Brick
- Central Region LQ 1.33
- Waco: Glass Containers
- Alamo Region LQ 1.12
- Fredericksburg: Cut Stone Products
- Upper Rio Grande LQ 1.23
- El Paso: Clay Building Material
Sources: Emsi, Texas Comptroller of Public Accounts
Source: Brookings Institution
TEXAS SUBSECTOR OUTPERFORMS
NATIONAL TRENDS
This Texas subsector pays higher average wages than the national average for the subsector, and its GDP and job growth have outpaced U.S. averages since 2010.
Sources: Emsi, U.S. Bureau of Economic Analysis, Texas Comptroller of Public Accounts
Conclusion
Manufacturing continues to drive output and productivity in the Texas economy, creating jobs paying well above the statewide average. It also contributes significantly to job creation in other industries, particularly in services.
Texas average wages for jobs in nonmetallic mineral products were nearly $58,000 in 2016, exceeding the subsector’s U.S. average wage of $56,000. And since 2010, subsector job growth and GDP have outperformed national gains. Its employment is concentrated in regions throughout Texas, and its state employment share is 12 percent higher than the U.S. average.