Skip navigation

Top navigation skipped
Information Overview Women in the Workforce
Information Snapshot | Printable Information Snapshot (PDF)
The information sector processes, produces and distributes data as well as various informational and cultural products. Technological advances have reduced employment gains within the sector, primarily in print-based publishing, broadcasting and telecommunications. In 2016, information contributed $55.3 billion to the Texas economy. Women account for 37 percent of the state’s 202,000 jobs in this sector.
Quick Facts
- Information contributed $55.3 billion to the Texas economy in 2016, nearly 4 percent of the total.
- The sector provided more than 202,000 jobs in 2017, 2 percent of all Texas jobs.
- Telecommunications had the largest share of jobs in the sector, at 41 percent.
- Between 2010 and 2017, the industry added more than 6,600 net additional positions, with the most growth in motion picture and sound recording (more than 8,000 jobs).
Average regional multipliers for information were used to estimate how an initial introduction of economic input in the sector, in the form of sales, jobs or earnings, affect the greater Texas economy. These multipliers capture “indirect” effects on industries that supply goods and services to the sector as well as “induced” effects on industries that sell local goods and services — such as housing, food or entertainment — to workers in the information sector and its suppliers (Exhibit 1).1
Exhibit 1: Average Type 2 Multipliers for Information
Jobs*
- Average Multiplier: 3.50
- For every 100 jobs created, an additional 250 jobs are created or affected in all other industries within the Texas economy.
Sales
- Average Multiplier: 2.11
- For every $1 million in sales, an additional $1.11 million in sales are generated by all other industries within the Texas economy.
Earnings
- Average Multiplier: 2.72
- For every $1 million in earnings generated, an additional $1.72 million in earnings are generated by all other industries within the Texas economy.
*The multiplier effect in this analysis is applicable to any worker in this industry and does not differentiate effects by gender.
Sources: Emsi and Texas Comptroller of Public Accounts
Texas Women in Information
In 2017, women held more than 75,000 jobs in information (Exhibit 2). Those jobs generate additional business activities that ultimately support about 187,000 other jobs in all other industries of the Texas economy. 2
| Description | NAICS Code* | Total Jobs | 2010 to 2017 Change | Average Earnings Per Job** | Women's Jobs | Women’s Share of Jobs |
|---|---|---|---|---|---|---|
| Information | 51 | 202,134 | 6,628 | $100,324 | 75,033 | 37% |
| Publishing Industries (except Internet) | 511 | 39,072 | -1,977 | $112,283 | 16,735 | 43% |
| Motion Picture and Sound Recording Industries | 512 | 24,761 | 8,374 | $38,184 | 9,883 | 40% |
| Broadcasting (except Internet) | 515 | 16,047 | -5,551 | $82,290 | 6,487 | 40% |
| Telecommunications | 517 | 81,868 | -4,397 | $107,546 | 25,928 | 32% |
| Data Processing, Hosting and Related Services | 518 | 32,695 | 7,002 | $126,263 | 12,490 | 38% |
| Other Information Services | 519 | 7,691 | 3,176 | $90,125 | 3,510 | 46% |
*The North American Industry Classification System (NAICS) is the federal system used to classify business establishments for statistical purposes.
**Based on total jobs in the industry including both genders.
Source: Emsi
Job growth and declines in subsectors of information truly reflect the changing demands of consumers and impact of automation. Though information added more than 6,600 positions from 2010 through 2017, overall growth was stymied by significant job losses in non-internet-related publishing and broadcasting and telecommunications.
In 2017, the telecommunications subsector had the highest number of jobs held by women (25,928). Other information services — which supplies, stores and provides access to information; operates web search portals; and facilitates publishing and/or broadcasting information exclusively on the internet — had the highest share of jobs held by women (46 percent).
Women make up 67 percent of customer service representatives, one of information’s top occupations by number of jobs (Exhibit 3).
| Description | Jobs in Sector | Total Jobs (All Sectors)* | Women's Share of Total Jobs |
|---|---|---|---|
| Telecommunications Equipment Installers and Repairers, except Line Installers | 17,938 | 25,194 | 11% |
| Customer Service Representatives | 14,504 | 260,763 | 67% |
| Sales Representatives, Services, All Other | 13,697 | 112,254 | 36% |
| Software Developers, Applications | 9,518 | 61,816 | 21% |
| Computer User Support Specialists | 6,297 | 61,985 | 27% |
*Other sectors employ workers with this occupation. This is a total for the occupation across sectors.
Source: Emsi
Earnings Growth
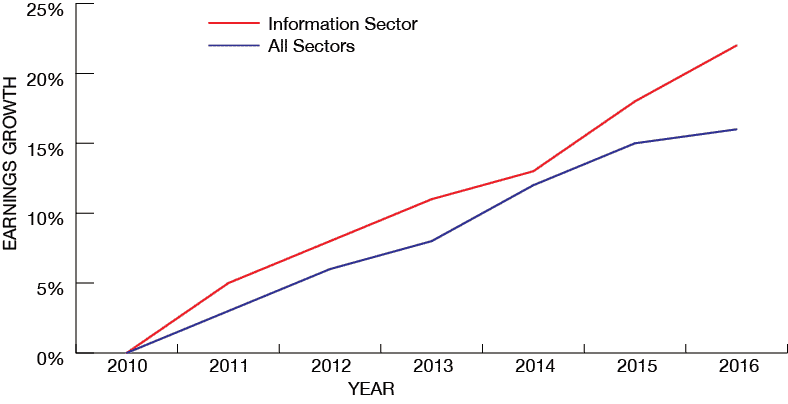
From 2010 to 2016, the average monthly earnings of women in information rose by 22 percent, outpacing the growth in monthly earnings of Texas women in all other sectors of the economy (Exhibit 4). Texas women in information earned an average of $5,365 per month, the fourth-highest average monthly wage, behind women working in the mining, quarrying and oil and gas extraction ($8,997), management of companies and enterprises ($5,598) and utilities ($5,483).
Exhibit 4: Growth in Average Monthly Earnings of Texas Women in Information (Indexed from 2010)
| Sector | 2010 | 2011 | 2012 | 2013 | 2014 | 2015 | 2016 |
|---|---|---|---|---|---|---|---|
| Information | 0% | 5% | 8% | 11% | 13% | 18% | 22% |
| All Sectors | 0% | 3% | 6% | 8% | 12% | 15% | 16% |
Source: U.S. Census Bureau Quarterly Workforce Indicators
Conclusion
While the demand for information has risen dramatically, technological advances increasingly have made the largely automated internet the preferred mode for its consumption. Within the information sector, women hold the highest share of total employment in establishments that facilitate the exchange of information over the internet. Texas women working in information generate additional business activities that ultimately support about 187,000 jobs in other industries throughout the state economy.
End Notes
-
The multipliers used in this analysis are averages of the Emsi Input-Output Model’s regional Type 2 earnings, sales and jobs multipliers for all six-digit NAICS categories within the information sector. The Comptroller’s office acknowledges that averaging multipliers introduces aggregation bias. This is a general approximation of multiplier effects on the government sector. For a more precise analysis of multiplier effects, analyze each six-digit NAICS category in the sector and its respective multipliers.
A direct effect is directly related to the production of the good or service of the industry in question. Indirect effects are generated in the businesses that supply goods and services to the industry that aid in the production of the good or service. Spending directly and indirectly generated incomes in the broader economy in turn creates induced effects.
Using the information sector in an example, direct jobs would include the number of workers in information. The jobs of a computer wholesaler that supplies the information sector are indirect jobs. The jobs of restaurant workers that serve information and computer wholesaler workers lunch are induced.
- The Type 2 jobs multiplier effect mentioned is based solely on the number of jobs held by women.
Additional State Research Tools
Use these lookup tools at other state agency websites to continue research of regional economic data.