Skip navigation

Top navigation skipped
Manufacturing Overview Women in the Workforce
Manufacturing Snapshot | Printable Manufacturing Snapshot (PDF)
The manufacturing sector transforms materials, substances or components into new products using mechanical, physical or chemical processes. As one of the broadest sectors of the economy, manufacturing includes 21 subsectors that create a wide range of products, from food and beverages to petrochemicals and automobiles. In 2016, manufacturing contributed $218.3 billion to Texas’ economy, the second-highest contributor behind financial activities. Women account for 27 percent of the state’s 843,000 jobs in this sector.
Quick Facts
- Manufacturing contributed $218.3 billion to Texas’ gross state product in 2016, more than 13 percent of the total.
- The sector provided nearly 843,000 jobs in 2017, 7 percent of all Texas jobs.
- Fabricated metal product manufacturing had the largest share of jobs in the sector in 2017, at nearly 14 percent.
- Between 2010 and 2017, the sector added more than 32,000 net additional positions, with the most growth in chemical manufacturing (more than 79,000).
Average regional multipliers for the manufacturing sector were used to estimate how an initial introduction of economic input in the sector, in the form of sales, jobs or earnings, affects the greater Texas economy. These multipliers capture “indirect” effects on industries that supply goods and services to the sector well as “induced” effects on industries that sell local goods and services — such as housing, food or entertainment — to workers in the manufacturing sector and its suppliers (Exhibit 1).1
Exhibit 1: Average Type 2 Multipliers for Manufacturing
Jobs*
- Average Multiplier: 3.66
- For every 100 jobs created, an additional 266 jobs are supported in all other industries within the Texas economy.
Sales
- Average Multiplier: 2.03
- For every $1 million in sales, an additional 1.03 million dollars in sales are generated by other industries within the Texas economy.
Earnings
- Average Multiplier: 2.88
- For every $1 million in earnings generated, an additional 1.88 million dollars in earnings are generated by other industries within the Texas economy.
*The multiplier effect in this analysis is applicable to any worker in this industry and does not differentiate effects by gender.
Sources: Emsi and Texas Comptroller of Public Accounts
Texas Women in Manufacturing
In 2017, women held nearly 229,000 jobs in manufacturing (Exhibit 2). Those jobs generate additional business activities that ultimately support about 609,000 jobs in all other industries of the Texas economy.2
| Description | NAICS Code* | Total Jobs | 2010 to 2017 Change | Average Earnings Per Job** | Women's Jobs | Women’s Share of Jobs |
|---|---|---|---|---|---|---|
| Food Manufacturing | 311 | 92,035 | 3,212 | $53,414 | 35,952 | 39% |
| Beverage and Tobacco Product Manufacturing | 312 | 15,889 | 4,699 | $73,174 | 3,741 | 24% |
| Textile Mills | 313 | 1,533 | -1,002 | $54,878 | 524 | 34% |
| Textile Product Mills | 314 | 5,721 | -168 | $42,131 | 2,977 | 52% |
| Apparel Manufacturing | 315 | 5,371 | 789 | $44,943 | 3,392 | 63% |
| Leather and Allied Product Manufacturing | 316 | 4,374 | 342 | $45,431 | 2,407 | 55% |
| Wood Product Manufacturing | 321 | 23,523 | 3,961 | $50,887 | 5,265 | 22% |
| Paper Manufacturing | 322 | 17,291 | -361 | $77,508 | 4,152 | 24% |
| Printing and Related Support Activities | 323 | 25,016 | -3,322 | $55,515 | 10,334 | 41% |
| Petroleum and Coal Products Manufacturing | 324 | 23,074 | -1,326 | $198,835 | 4,397 | 19% |
| Chemical Manufacturing | 325 | 79,192 | 8,796 | $137,950 | 20,065 | 25% |
| Plastics and Rubber Products Manufacturing | 326 | 37,947 | 735 | $62,912 | 11,297 | 30% |
| Nonmetallic Mineral Product Manufacturing | 327 | 38,104 | 5,165 | $71,528 | 6,230 | 16% |
| Primary Metal Manufacturing | 331 | 19,359 | -387 | $73,725 | 3,130 | 16% |
| Fabricated Metal Product Manufacturing | 332 | 116,807 | 4,677 | $71,736 | 23,572 | 20% |
| Machinery Manufacturing | 333 | 85,414 | -67 | $101,577 | 18,343 | 21% |
| Computer and Electronic Product Manufacturing | 334 | 90,280 | -4,508 | $150,322 | 26,893 | 30% |
| Electrical Equipment, Appliance and Component Manufacturing | 335 | 18,475 | 1,531 | $96,440 | 5,144 | 28% |
| Transportation Equipment Manufacturing | 336 | 89,465 | 5,553 | $103,320 | 21,201 | 24% |
| Furniture and Related Product Manufacturing | 337 | 23,281 | 922 | $51,187 | 6,670 | 29% |
| Miscellaneous Manufacturing | 339 | 30,364 | 3,114 | $74,966 | 13,065 | 43% |
| Manufacturing, Total | 31-33 | 842,513 | 32,353 | $92,511 | 228,750 | 27% |
*The North American Industry Classification System (NAICS) is the federal system used to classify business establishments for statistical purposes.
**Based on total jobs in the industry including both genders. Earnings include salaries, wages, benefits and other compensation.
Source: Emsi
Of all subsectors within manufacturing, women had their highest share of employment in apparel manufacturing, with 63 percent of Texas jobs in 2017. In addition, women also accounted for more than half of employment in textile product mills and leather and allied product manufacturing. Food manufacturing had the highest number of positions held by women, with 35,952 jobs.
Women account for 20 percent of all jobs in fabricated metal product manufacturing, the largest employing subsector by job count and 25 percent of all jobs in chemical manufacturing, the subsector with the highest job growth.
Exhibit 3 lists the top occupations in manufacturing by number of jobs, all of them production oriented. Of manufacturing’s top five occupations, women are most represented as team assemblers and inspectors, testers, sorters, samplers and weighers. It’s important to note that women in manufacturing are more likely to work in professional and administrative positions, such as accountants and administrative assistants.
| Description | Jobs in Sector | Total Jobs (All Sectors)* |
Women's Share of Total Jobs |
|---|---|---|---|
| Team Assemblers | 35,256 | 48,798 | 38% |
| First-Line Supervisors of Production and Operating Workers | 31,757 | 47,873 | 18% |
| Welders, Cutters, Solderers and Brazers | 29,353 | 53,024 | 6% |
| Inspectors, Testers, Sorters, Samplers and Weighers | 27,744 | 51,177 | 38% |
| Helpers — Production Workers | 21,921 | 43,885 | 25% |
*Other sectors employ workers with this occupation. This is a total for the occupation across sectors.
Source: Emsi
Earnings Growth
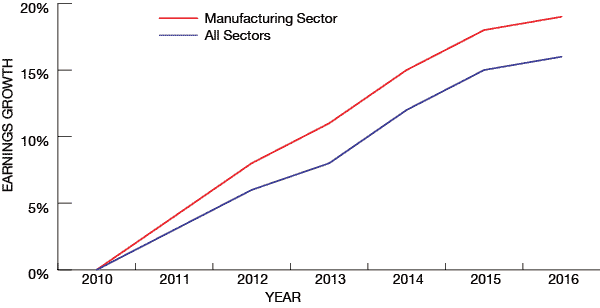
In 2016, women in construction earned $4,705 per month on average, up 19 percent from 2010 (Exhibit 4). Earnings in manufacturing vary widely among the subsectors. The three subsectors with the highest shares of women — apparel manufacturing, textile product mills and leather and allied product manufacturing — are among the lowest-paid manufacturing fields.
Exhibit 4: Growth in Average Monthly Earnings of Texas Women in Manufacturing (Indexed from 2010)
| Sector | 2010 | 2011 | 2012 | 2013 | 2014 | 2015 | 2016 |
|---|---|---|---|---|---|---|---|
| Manufacturing | 0% | 4% | 8% | 11% | 15% | 18% | 19% |
| All Sectors | 0% | 3% | 6% | 8% | 12% | 15% | 16% |
Source: U.S. Census Bureau Quarterly Workforce Indicators
Conclusion
The manufacturing sector faces a number of challenges, most notably a shortage of trained and skilled workers. In the last few decades, industry leaders increasingly have viewed women as a solution to their skills needs. The number of women in manufacturing is growing slowly but steadily, due to various initiatives steering women into science, technology, engineering and math, but the sector is also working to change the public perception of manufacturing as a career choice and modernizing the workplace in ways that will attract younger generations.
Currently, women working in manufacturing generate additional business activities that ultimately support about 609,000 jobs in all other industries of the state economy. With time, Texas’ manufacturing sector will increasingly reap the benefits of women’s unique perspectives and leadership styles.
End Notes
-
The multipliers used in this analysis are averages of the Emsi Input-Output Model’s regional Type 2 earnings, sales and jobs multipliers for all six-digit NAICS categories within the manufacturing sector. The Comptroller’s office acknowledges that averaging multipliers introduces aggregation bias. This is a general approximation of multiplier effects on the government sector. For a more precise analysis of multiplier effects, analyze each six-digit NAICS category in the sector and its respective multipliers.
A direct effect is directly related to the production of the good or service of the industry in question. Indirect effects are generated in the businesses that supply goods and services to the industry that aid in the production of the good or service. Spending directly and indirectly generated incomes in the broader economy in turn creates induced effects.
Using the manufacturing sector as an example, direct jobs would include workers in manufacturing. The jobs of a lumber wholesaler that supplies the manufacturing sector are indirect jobs. The jobs of restaurant workers who serve lunch to manufacturing and lumber wholesaler workers are induced.
- The Type 2 jobs multiplier effect mentioned is based solely on the number of jobs held by women.