Skip navigation

Top navigation skipped
Professional and Business Services Overview Women in the Workforce
Professional and Business Services Snapshot | Printable Professional and Business Services Snapshot (PDF)
The professional and business services industry, sometimes called a “super sector,” comprises three sectors — professional, scientific and technical services; management of companies and enterprises; and administrative and support and waste management and remediation services. In 2016, professional and business services contributed $179.4 billion to Texas’ economy. Women account for 45 percent of the state’s 1.6 million jobs in this industry.
Quick Facts
- Professional and business services contributed $179.4 billion to Texas’ gross state product (GSP) in 2016, about 11 percent of the total.
- Professional, scientific and technical services accounted for the largest share of GSP, at $106.3 billion.
- The industry employed more than 1,647,000 in 2017, 13 percent of all Texas jobs.
- Administrative and support and waste management and remediation services had the largest share of jobs in the industry, at 49 percent.
- Between 2010 and 2017, the industry added nearly 371,000 positions, with the most growth in professional, scientific and technical services (more than 165,000 jobs).
Average regional multipliers for professional and business services were used to estimate how an initial introduction of economic input in the industry, in the form of sales, jobs or earnings, affect the greater Texas economy. These multipliers capture “indirect” effects on industries that supply goods and services to the industry as well as “induced” effects on industries that sell local goods and services — such as housing, food or entertainment — to workers in the professional and business services industry and its suppliers (Exhibit 1).1
Exhibit 1: Average Type 2 Multipliers for Professional and Business Services
| Sector/Subsector | Sales | Jobs* | Earnings |
|---|---|---|---|
| Professional and Business Services | 2.43 | 2.51 | 2.15 |
| Professional, Scientific and Technical Services | 2.42 | 2.54 | 2.05 |
| Management of Companies and Enterprises | 2.46 | 4.23 | 2.03 |
| Administrative and Support and Waste Management and Remediation Services | 2.45 | 2.36 | 2.26 |
The overall multiplier effects are as follows:
- Jobs
- For every 100 jobs created, an additional 151 jobs are supported in all other industries within the Texas economy.
- Sales
- For every $1 million in sales, an additional 1.43 million dollars in sales are generated by other industries within the Texas economy.
- Earnings
- For every $1 million in earnings generated, an additional 1.15 million dollars in earnings are generated by other industries within the Texas economy.
*The multiplier effect in this analysis is applicable to any worker in this industry and does not differentiate effects by gender.
Sources: Emsi and Texas Comptroller of Public Accounts
Texas Women in Professional and Business Services
In 2017, women held more than 733,000 jobs in professional and business services (Exhibit 2). Those jobs generate additional business activities that ultimately support about 1.1 million jobs in other industries of the Texas economy. 2
| Description | NAICS Code* | Total Jobs | 2010 to 2017 Change | Average Earnings Per Job** | Women's Jobs | Women’s Share of Jobs |
|---|---|---|---|---|---|---|
| Professional, Scientific and Technical Services | 54 | 734,955 | 165,462 | $103,858 | 324,574 | 44% |
| Professional, Scientific and Technical Services | 541 | 734,955 | 165,462 | $103,858 | 324,574 | 44% |
| Legal Services | 5411 | 85,781 | 7,487 | $110,841 | 56,517 | 66% |
| Accounting, Tax Preparation, Bookkeeping and Payroll Services | 5412 | 84,196 | 17,692 | $78,400 | 51,376 | 61% |
| Architectural, Engineering and Related Services | 5413 | 144,492 | 9,440 | $112,037 | 38,278 | 26% |
| Specialized Design Services | 5414 | 9,298 | 2,116 | $68,090 | 4,876 | 52% |
| Computer Systems Design and Related Services | 5415 | 170,203 | 68,470 | $121,044 | 51,818 | 30% |
| Management, Scientific and Technical Consulting Services | 5416 | 134,844 | 49,778 | $107,459 | 61,001 | 45% |
| Scientific Research and Development Services | 5417 | 24,363 | 539 | $120,770 | 11,054 | 45% |
| Advertising, Public Relations and Related Services | 5418 | 27,319 | 2,627 | $76,438 | 14,899 | 55% |
| Other Professional, Scientific and Technical Services | 5419 | 54,459 | 7,314 | $60,178 | 34,755 | 64% |
| Management of Companies and Enterprises | 55 | 123,761 | 44,489 | $147,971 | 59,577 | 48% |
| Management of Companies and Enterprises | 551 | 123,761 | 44,489 | $147,971 | 59,577 | 48% |
| Management of Companies and Enterprises | 5511 | 123,761 | 44,489 | $147,971 | 59,577 | 48% |
| Administrative and Support and Waste Management and Remediation Services | 56 | 788,286 | 160,886 | $49,178 | 349,176 | 44% |
| Administrative and Support Services | 561 | 755,484 | 153,147 | $48,204 | 342,319 | 45% |
| Office Administrative Services | 5611 | 76,431 | 20,401 | $100,601 | 40,785 | 53% |
| Facilities Support Services | 5612 | 13,895 | -1,328 | $64,440 | 6,104 | 44% |
| Employment Services | 5613 | 290,469 | 68,904 | $43,548 | 128,838 | 44% |
| Business Support Services | 5614 | 98,596 | 8,198 | $47,318 | 58,759 | 60% |
| Travel Arrangement and Reservation Services | 5615 | 16,624 | 4,000 | $71,931 | 10,420 | 63% |
| Investigation and Security Services | 5616 | 78,735 | 14,498 | $39,082 | 24,316 | 31% |
| Services to Buildings and Dwellings | 5617 | 162,811 | 34,624 | $32,580 | 66,230 | 41% |
| Other Support Services | 5619 | 17,921 | 3,847 | $52,503 | 6,866 | 38% |
| Waste Management and Remediation Services | 562 | 32,802 | 7,739 | $71,608 | 6,857 | 21% |
| Waste Collection | 5621 | 10,545 | 3,110 | $54,098 | 1,964 | 19% |
| Waste Treatment and Disposal | 5622 | 12,173 | 2,406 | $96,523 | 2,607 | 21% |
| Remediation and Other Waste Management Services | 5629 | 10,084 | 2,222 | $59,842 | 2,286 | 23% |
| Professional and Business Services, Total | 54-56 | 1,647,002 | 370,837 | $81,002 | 733,326 | 45% |
*The North American Industry Classification System (NAICS) is the federal system used to classify business establishments for statistical purposes.
**Based on total jobs in the industry including both genders. Earnings include salaries, wages, benefits and other compensation.
Source: Emsi
Professional, Scientific and Technical Services
As the name implies, the professional, scientific and technical services sector provides a variety of services to clients in many industries. Compared to other sectors of the economy, professional, scientific and technical services require a high degree of training and expertise.In 2017, this sector accounted for nearly 45 percent of employment in the professional and business services industry (734,955 jobs). Women held 44 percent of all professional, scientific and technical services jobs and more than 60 percent of jobs in legal services, accounting, tax preparation, bookkeeping and payroll and other professional, scientific and technical services — two of the highest-paying subsectors.
Women are well represented in the top occupations employed in the sector, most notably as accountants and auditors (60 percent) and general office clerks (82 percent) (Exhibit 3).
| Description | Jobs in Sector | Total Jobs (All Sectors)* |
Women's Share of Total Jobs |
|---|---|---|---|
| Accountants and Auditors | 42,773 | 122,779 | 60% |
| Office Clerks, General | 32,870 | 388,682 | 82% |
| Software Developers, Applications | 30,079 | 61,816 | 21% |
| Lawyers | 28,243 | 44,035 | 37% |
| Computer Systems Analysts | 23,670 | 59,422 | 34% |
*Other sectors employ workers with this occupation. This is a total for the occupation across sectors.
Source: Emsi
Management of Companies and Enterprises
Management of companies and enterprises comprises firms that operate by holding securities and other equity interests of companies for the purpose of owning a controlling interest and influencing management decisions. Others may oversee and manage establishments belonging to certain companies or enterprises.Management of companies and enterprises is the smallest sector of the Texas economy in terms of employment, with 123,761 jobs in 2017. In this sector, women held 59,577 Texas jobs, 48 percent of the total.
Women held significant shares of jobs in the sector’s top occupations. In addition to accountants, auditors and office clerks, women account for impressively high shares of customer services representatives (67 percent) and bookkeeping, accounting and auditing clerks (88 percent) (Exhibit 4).
| Description | Jobs in Sector | Total Jobs (All Sectors)* |
Women's Share of Total Jobs |
|---|---|---|---|
| Accountants and Auditors | 6,221 | 122,779 | 60% |
| Customer Service Representatives | 6,167 | 260,763 | 67% |
| General and Operations Managers | 4,462 | 173,541 | 28% |
| Office Clerks, General | 4,237 | 388,682 | 82% |
| Bookkeeping, Accounting and Auditing Clerks | 4,216 | 133,409 | 88% |
*Other sectors employ workers with this occupation. This is a total for the occupation across sectors.
Source: Emsi
Administrative and Support and Waste Management and Remediation Services
The administrative and support and waste management and remediation services sector, which performs routine support activities for the day-to-day operations of other organizations, provides the most employment of all sectors within the professional and business services industry, accounting for nearly 48 percent of all Texas jobs.
In 2017, Texas women held the highest number and largest share of total jobs in administrative and support services, with 341,319 jobs and 45 percent of total employment.
Women held relatively low shares of the sector’s top occupations, with the exception of customer service representatives (Exhibit 5).
| Description | Jobs in Sector | Total Jobs (All Sectors)* |
Women's Share of Total Jobs |
|---|---|---|---|
| Janitors and Cleaners, Except Maids and Housekeeping Cleaners | 74,942 | 187,762 | 32% |
| Security Guards | 57,001 | 91,896 | 25% |
| Customer Service Representatives | 56,775 | 260,763 | 67% |
| Laborers and Freight, Stock and Material Movers, Hand | 39,009 | 182,132 | 18% |
| Landscaping and Groundskeeping Workers | 38,442 | 69,633 | 13% |
*Other sectors employ workers with this occupation. This is a total for the occupation across sectors.
Source: Emsi
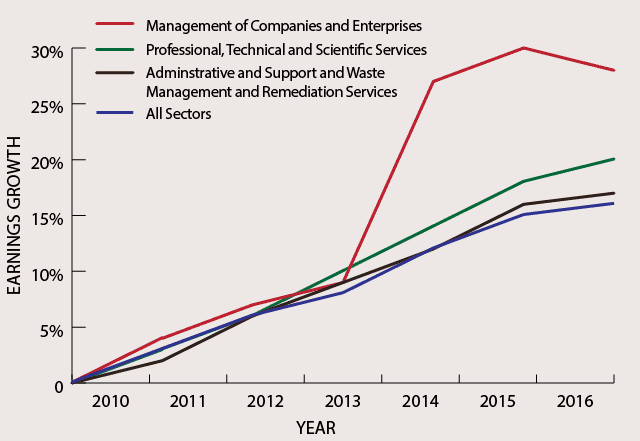
Earnings Growth
From 2010 to 2016, average monthly earnings of women increased in all three sectors of professional and business services. Women working in management of companies and enterprises saw their earnings rise the most, by 28 percent (Exhibit 6). On average, Texas women in management of companies and enterprises earned $5,598 a month; administrative and support and waste management and remediation services, $3,174; and professional, scientific and technical services, $5,338 per month.
Exhibit 6: Growth in Average Monthly Earnings of Texas Women in Professional and Business Services (Indexed from 2010)
| Sector | 2010 | 2011 | 2012 | 2013 | 2014 | 2015 | 2016 |
|---|---|---|---|---|---|---|---|
| Professional, Scientific and Technical Services | 0% | 3% | 6% | 10% | 14% | 18% | 20% |
| Management of Companies and Enterprises | 0% | 4% | 7% | 9% | 27% | 30% | 28% |
| Administrative and Support and Waste Management and Remediation Services | 0% | 2% | 6% | 9% | 12% | 16% | 17% |
| All Sectors | 0% | 3% | 6% | 8% | 12% | 15% | 16% |
Source: U.S. Census Bureau Quarterly Workforce Indicators
Conclusion
The professional and business services industry offers a wealth of opportunities for women. Of all women-owned businesses nationally, 12 percent were in the professional, scientific and technical services subsector — the third-highest share across all sectors of the economy. In addition, management of companies and enterprises and professional, scientific and technical services are both among the top five highest-earning sectors for Texas women.
Texas women working in professional and business services generate additional business activities that ultimately support about 1.1 million jobs in other industries throughout the state economy.
End Notes
-
The multipliers used in this analysis are averages of the Emsi Input-Output Model’s regional Type 2 earnings, sales and jobs multipliers for all six-digit NAICS categories within this industry. The Comptroller’s office acknowledges that averaging multipliers introduces aggregation bias. This is a general approximation of multiplier effects on this sector. For a more precise analysis of multiplier effects, analyze each six-digit NAICS category in the sector and its respective multipliers.
A direct effect is directly related to the production of the good or service of the industry in question. Indirect effects are generated in the businesses that supply goods and services to the industry that aid in the production of the good or service. Spending directly and indirectly generated incomes in the broader economy in turn creates induced effects.
Using the professional and business services industry as an example, direct jobs would include the number of workers in professional and business services. The jobs of a computer wholesaler that supplies the professional and business services industry are indirect jobs. The jobs of restaurant workers who serve lunch to professional and business services and computer wholesaler workers are induced.
- The Type 2 jobs multiplier effect mentioned is based solely on the number of jobs held by women.