Skip navigation

Top navigation skipped
Revenue Available for General
Infographics Library


2024-2025 Biennium Financials

State and Federal Funding


2022-2023 Biennium Financials


2020-2021 Biennium Financials

2018-2019 Biennium Financials
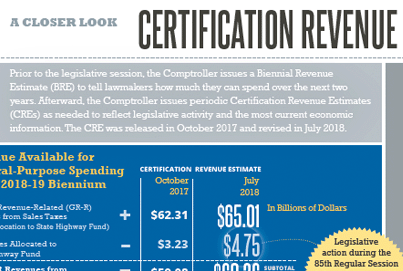
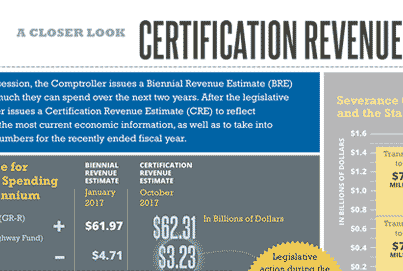


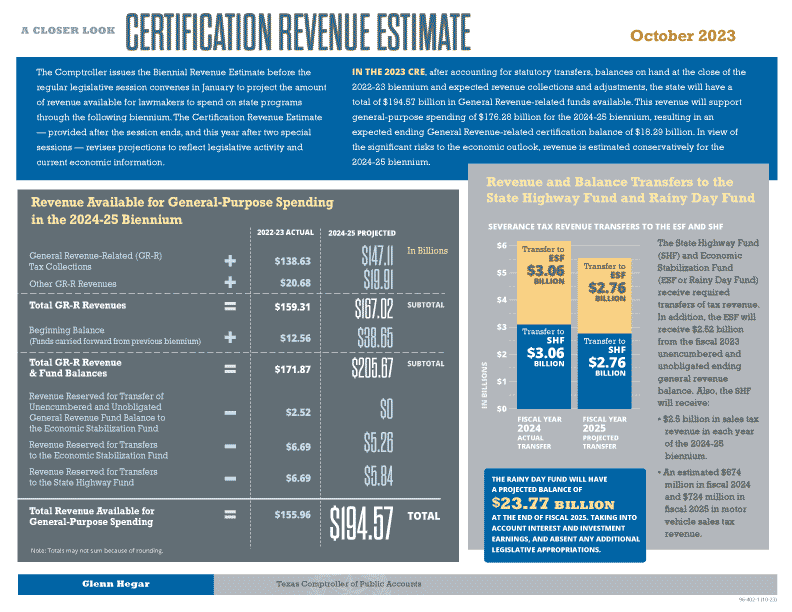
A CLOSER LOOK Certification Revenue Estimate
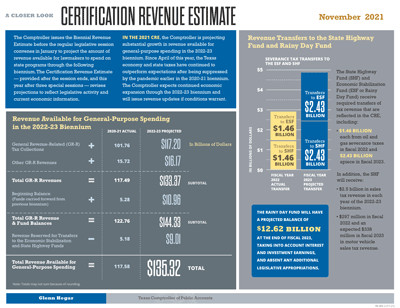
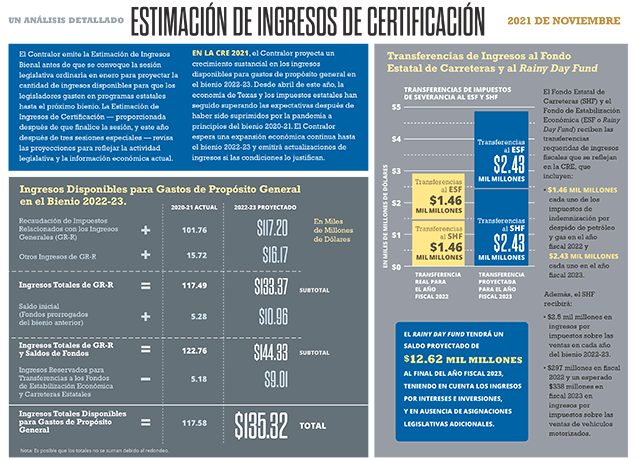
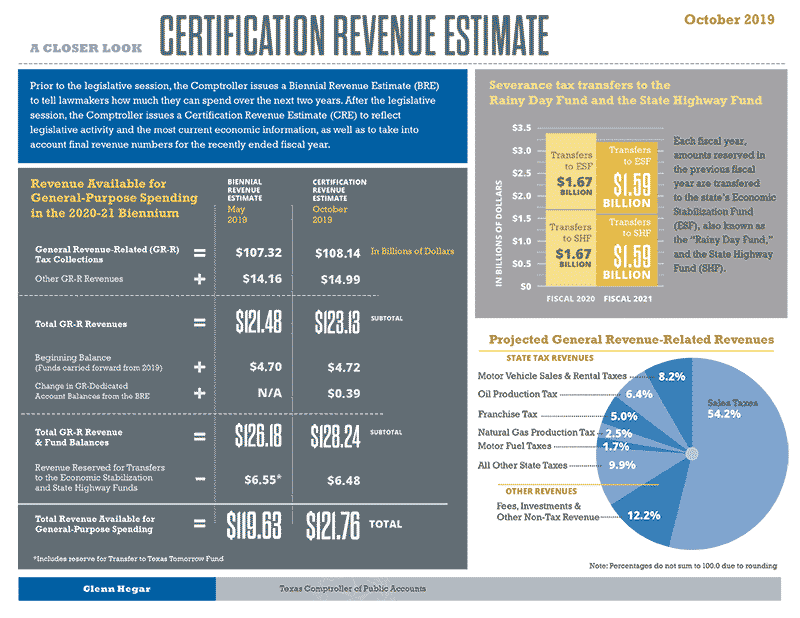
Prior to the legislative session, the Comptroller issues a Biennial Revenue Estimate (BRE) to tell lawmakers how much they can spend over the next two years. After the legislative session, the Comptroller issues a Certification Revenue Estimate (CRE) to reflect legislative activity and the most current economic information, as well as to take into account final revenue numbers for the recently ended fiscal year.
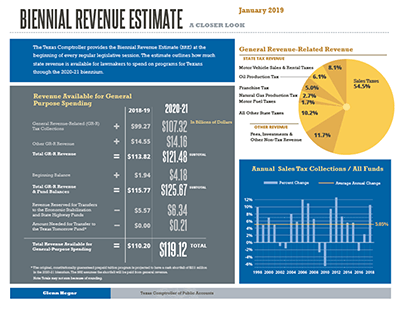
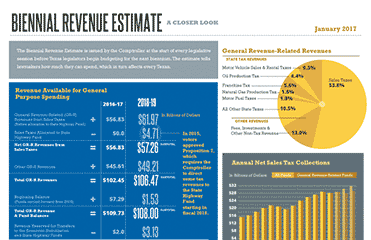
Revenue Available for General
Purpose Spending in the
2020-21 Biennium(In Billions of Dollars)
| Revenue | Oper ation |
Biennial Revenue Estimate May 2019 |
Certification Revenue Estimate October 2019 |
Notes |
|---|---|---|---|---|
| General Revenue-Related (GR-R) Tax Collections |
$107.32 | $108.14 | ||
| Other GR-R Revenues | plus$14.16 | plus$14.99 | ||
| Total GR-R Revenues | equals$121.48 | equals$123.13 | ||
|
Beginning Balance (Funds carried forward from 2019) |
plus$4.70 | plus$4.72 | ||
|
Change in GR-Dedicated Account Balances from the BRE |
plusN/A | plus$0.39 | ||
|
Total GR-R Revenue & Fund Balances |
equals$126.18 | equals$128.24 | SUBTOTAL | |
| Revenue Reserved for Transfers to the Economic Stabilization and State Highway Funds | minus$6.55* | minus$6.48 | ||
| Total Revenue Available for General-Purpose Spending | equals$119.63 | equals$121.76 | TOTAL |
* Includes reserve for transfer to Texas Tomorrow Fund
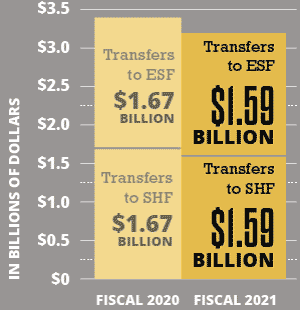
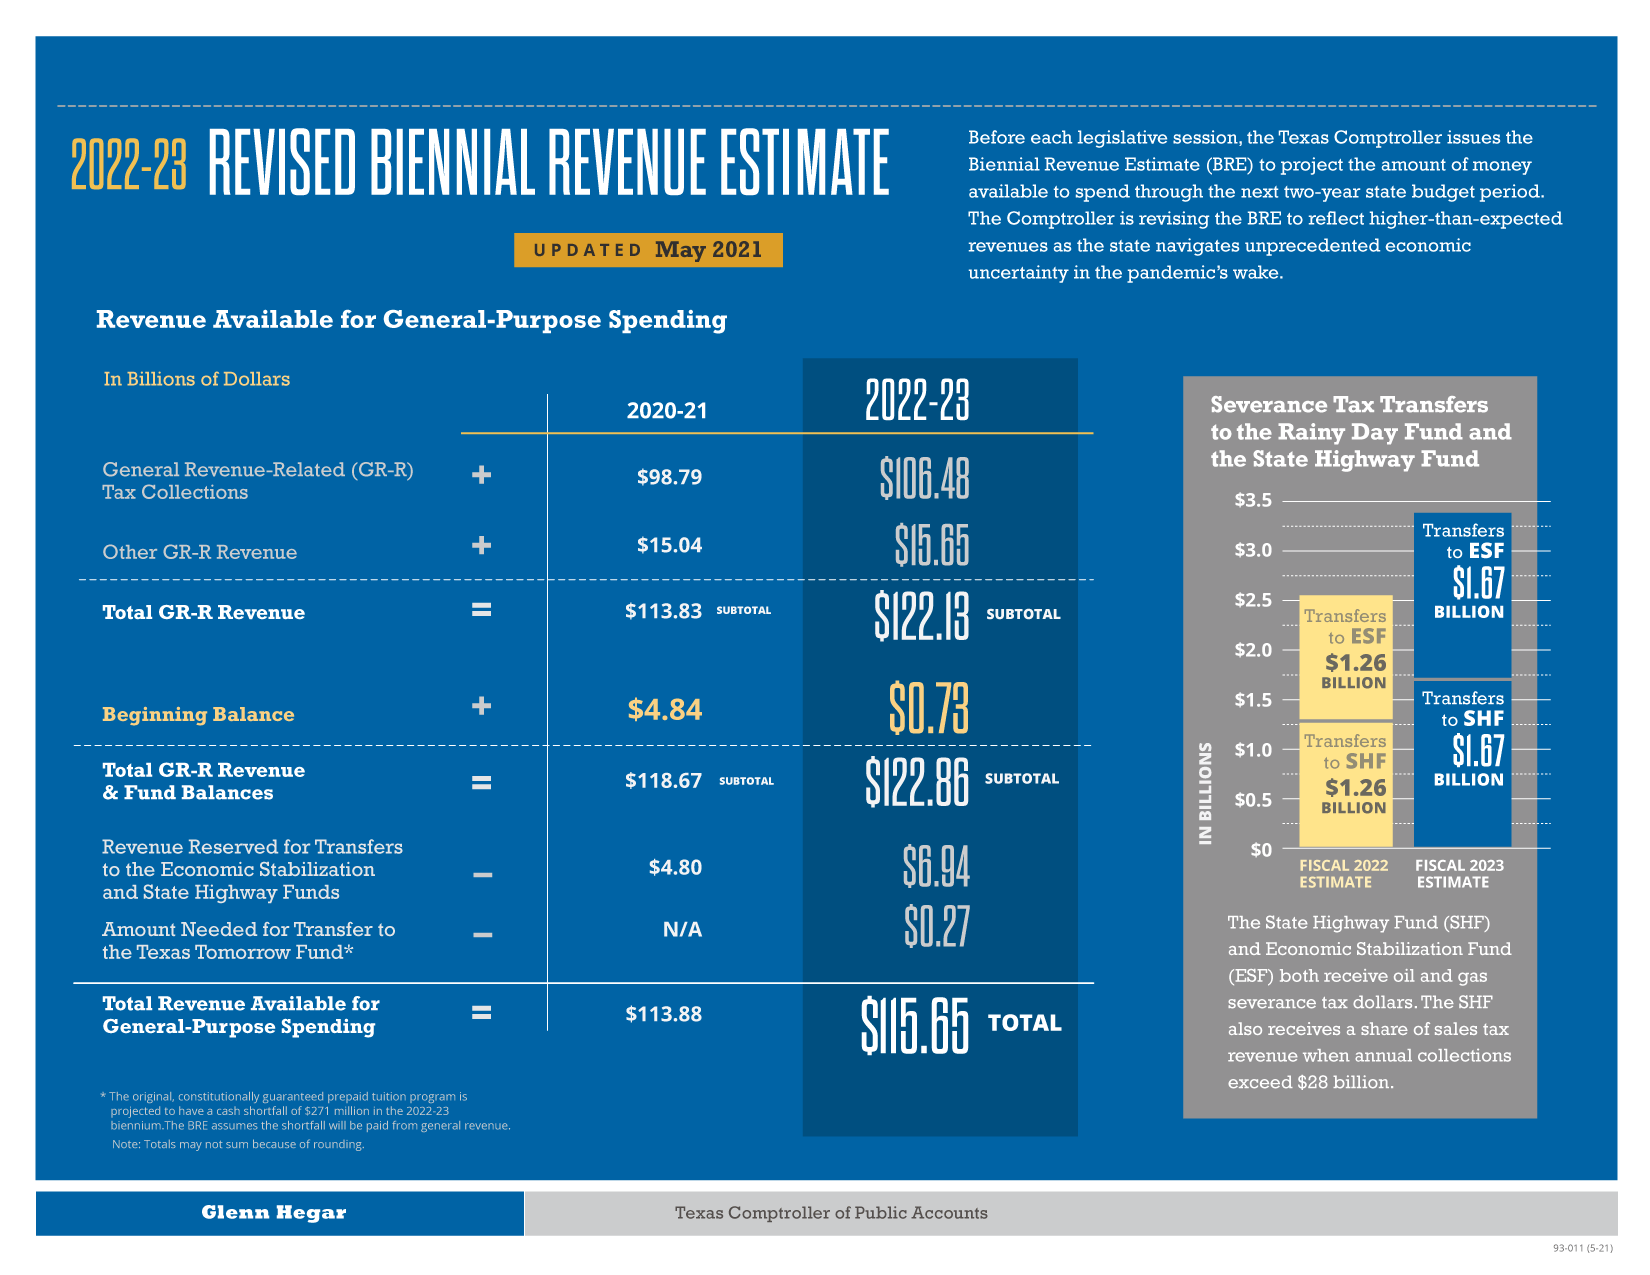
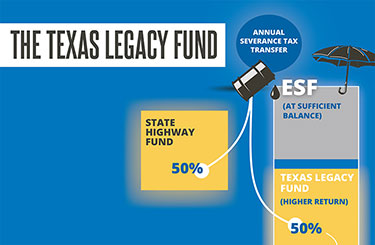
Severance tax transfers to the Rainy Day Fund and the State Highway Fund
Each fiscal year, amounts reserved in the previous fiscal year are transferred to the state’s Economic Stabilization Fund (ESF), also known as the “Rainy Day Fund,” and the State Highway Fund (SHF).
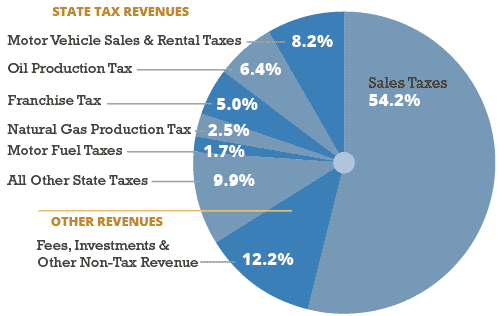
Projected General Revenue-Related Revenues
Note: Percentages do not sum to 100.0 due to rounding.
| Revenue Source | Percent of Total |
|---|---|
| Motor Vehicle Sales and Rental Taxes | 8.2% |
| Oil Production Tax | 6.4% |
| Francise Tax | 5.0% |
| Motor Fuel Taxes | 1.7% |
| Natural Gas Production Tax | 2.5% |
| All Other State Taxes | 9.9% |
| Sales Taxes | 54.2% |
| Fees, Investments and Other Non-Tax Revenue | 12.2% |